


 |
|
 |
|
 |
|
 |
|
 |
|
 |
|
 |
|
 |
|
 |
|
 |
|
 |
|
 |
|
 |
|
 |
|
 |
|
Cryptocurrency News Video
[Two moving averages are rising and falling] Bitcoin’s six-hour downward trend against the US dollar continues to fluctuate (202505032129)
May 03, 2025 at 01:42 pm 一切都是刚刚开始
. After the 6-hour selling point of Bitcoin against the US dollar is confirmed at 109466 points, at 88768 points, it is confirmed again that the 6-hour selling point has appeared. In the future, if a 74495 upward weekly line is formed, the 6-hour downward trend will be destroyed. At this time, as long as the next turn of the daily line is completed, the 6-hour buying point confirmation point will be confirmed; and after the 109466 points of the daily line is confirmed, if a 74495 upward weekly line is formed in the future, the 74495 upward weekly line is formed, and the 2-hour selling point at the daily line will be confirmed. From the 2-day selling point downward, at least the center of the weekly line in the weekly line cycle chart and the last three downwards will be confirmed. Only when the third turn falls below the lowest point of the first turn can the daily buying point confirmation point be confirmed. The practical application of the investment market in "Mathematical Principles of Market Philosophy" is based on the moving average as the table and the theory of chanting as the inside. It uses the relationship between the 5-day and 10-day moving averages to analyze the rise and fall of the long and short markets, and tells the whole life, death, end and death. All interpretations of this channel use pen instead of line segments to build a center. After establishing the trend level, the theory of chanting is used in actual combat to analyze and explore the current buying and selling points and technical trends of all investment markets such as global stocks, exchange rates, crude oil, and Bitcoin. Disclaimer: All my technical analysis of the Chaos Theory is for sharing personal investment experience, experience and opinions, and is not investment advice. I am only responsible for my own investment profit and loss, and shall not be responsible for the investment behavior of any individual or institution. No viewpoints in the video constitute investment advice to any individual or institution. #Stock#Exchange Rate#Investment#S&P#A shares#Taiwan Stocks#Hong Kong Stocks#Crude Oil#US dollar#RMB#Gold#Nike#Channer#U.S. Stocks
Disclaimer:info@kdj.com
The information provided is not trading advice. kdj.com does not assume any responsibility for any investments made based on the information provided in this article. Cryptocurrencies are highly volatile and it is highly recommended that you invest with caution after thorough research!
If you believe that the content used on this website infringes your copyright, please contact us immediately (info@kdj.com) and we will delete it promptly.
-

- VIRTUAL PROTOCOL PRICE PREDICTION 2025 | VIRTUAL CRYPTO 4X-5X🤑 | VIRTUAL COIN NEWS TODAY | ALTS COIN
- May 07, 2025 at 07:10 pm Kri Trade
- VIRTUAL PROTOCOL PRICE PREDICTION 2025 | VIRTUAL CRYPTO 4X-5X🤑 | VIRTUAL COIN NEWS TODAY | ALTS COIN NEWS TODAY | VIRTUAL CRYPTO UPDATE | CRYPTO NEWS | Join this channel to get access to perks:...
-

-

- Is Bitcoin going to make $100,000? Is the interest rate meeting a good or bad? What new progress has been made in tariff negotiations? #btc #eth
- May 07, 2025 at 07:05 pm 加密昌健
- Timeline: 00:00 Summary 03:50 What will the US bond auction absorb market funds? 05:48 Guanshuo what progress has been made in the negotiations? 09:13 Is the interest rate meeting a good or bad? 12:26 What will the market go next? 【Contact Us】 WeChat: changjian033/changjian020 TG group: https://t.me/th4ukEY2r0A0YThl #ethereum #btc #crypto #bitcoin #blockchain#...
-
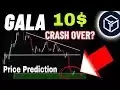
- GALA Coin Price Prediction 2025 Ready to Explode 🔥 | Massive Price Prediction & Gala Crypto News!
- May 07, 2025 at 07:05 pm Noman Fida
- GALA Coin Ready to Explode in 2025? 🔥 | Massive Price Prediction & Gala Crypto News! GALA Coin Ready to Explode in 2024? 🔥 | Massive Price Prediction & Gala Crypto News! #galacoin ...
-
-

-

- Stake bob crypto corner on bob corner and boost your crypto yield at 952% APY
- May 07, 2025 at 06:55 pm Crypto Bourgeau
- "Stake Bob Crypto Coin and starts winning them now: ➡️ https://bob-sushi.xyz #Bob Cryptocoin #Bob Coin #Bob Cryptotokens #Staking #Bob Coinstaking #Bob Cryptocrypto #cryptostking ...
-

- No tax, No KYC Sell USDT direct ! how to sell usdt on binance p2p ! Binance me usdt sell kaise kare
- May 07, 2025 at 06:55 pm Master Technology 403
- No tax, No KYC Sell USDT direct ! how to sell usdt on binance p2p ! Binance me usdt sell kaise kare https://t.me/+bzuqg5Izcl4yMWRl Joining Link......https://invite.rupayal.com?code=609813 Business...
-