


 |
|
 |
|
 |
|
 |
|
 |
|
 |
|
 |
|
 |
|
 |
|
 |
|
 |
|
 |
|
 |
|
 |
|
 |
|
Cryptocurrency News Video
2025.5.21 Bitcoin hit a high in the early morning! The idea of bottoming out and buying low in the day!
May 21, 2025 at 02:43 am 比特币队长Captain
Assistant's only telegram: bpq2020 (Note that bpq2020Msg is a liar!) Click the link to add Assistant's telegram: https://t.me/bpq2020 Bitcoin's real-time changes, what can be done is to analyze the next trend with a higher probability based on the current structure, and thus make a trading plan with a suitable profit-loss ratio. Generally, there is a top-bottom structure (double bottom, triangle, head and shoulder bottom, arc bottom, V bottom) which is easy for retail investors to identify and are likely to get out of the band. The pursuit of grabbing bands is the core password for continuous and stable outperforming the market. Summary of my 8 years of Bitcoin trading experience: superstitious analysis, blindly following operations, firm belief, high-powered Soha will definitely lose money as soon as possible! I wish all my friends who follow me good luck and always accompany you! [About the analysis timeline] 1H corresponds to a 1-3-day cycle, and the band corresponds to an amplitude of about US$2,000. 4H corresponds to a 7-20-day cycle, and the band corresponds to an amplitude of about US$5,000. The daily line corresponds to a 20-2-month cycle, and the band corresponds to an amplitude of about US$10,000. The weekly line corresponds to a 3-6-month cycle, and the band corresponds to an amplitude of about US$30,000. [About the analysis of common indicators] 1. Cloud diagram (one-picture balance table Ichimoku), default parameters, commonly used first-hand belt A and first-hand belt B. Use this indicator to determine the corresponding level of the top and bottom structure and the trend direction. This indicator is the main reference. In addition to searching for free indicator explanations on Youtube, we also have advanced paid course learning guidance. 2. MACD, the default parameter, is often used to judge deviation and assist in reference. 3. Trading volume is often used to judge the strength at the end of the trend and assist in reference. All the comments in this video and this article do not constitute any investment advice! For learning and communication only. #Bitcoin#Bitcoin Quotation#BTC#BTC#Crime Techniques#Crime Speculation Strategy#Crime Speculation Experience#Bitcoin Quotation#Captain Bitcoin#CaptainBTC#Bitcoin Mining#Bitcoin Captain#Bitcoin Captain
Disclaimer:info@kdj.com
The information provided is not trading advice. kdj.com does not assume any responsibility for any investments made based on the information provided in this article. Cryptocurrencies are highly volatile and it is highly recommended that you invest with caution after thorough research!
If you believe that the content used on this website infringes your copyright, please contact us immediately (info@kdj.com) and we will delete it promptly.
-

- "Bitcoin isn't digital gold at all?" - Subverting your millennium understanding of currency
- May 22, 2025 at 12:45 am 未来币道
- The birth of Bitcoin marks the first time that humans have created a monetary system with fixed total volume and no trusted intermediaries through mathematics and technology. This article compares the essential differences between Bitcoin and gold from three dimensions: scarcity, differentiability, and verifiability: Scarcity: Gold depends on natural constraints, and Bitcoin locks the upper limit of 21 million coins through code; Differentifiability: Gold is difficult to divide and is used for daily transactions, and the smallest unit of Bitcoin "Shun" realizes payment of USD 0.001; Verification: Gold audit relies on warehouse inventory evidence half a century ago, and the data on the Bitcoin chain is transparent and verifiable in real time. The article further reveals that...
-
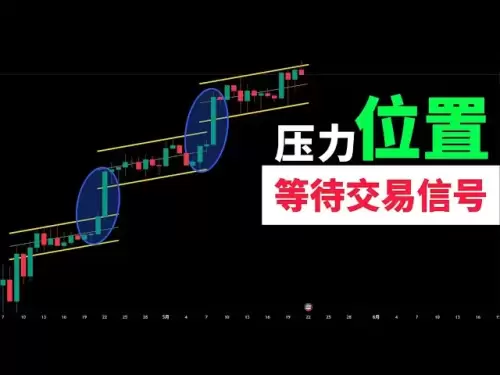
- 5-21 Bitcoin hits the high pressure position before the front! ! Please wait patiently for long trading signals in the short term in the day, don’t rush to enter the market #trading #crypto #bitcoin price #lead #Ethereum
- May 22, 2025 at 12:45 am 比特币大伟
- ⭐Wealth Password Contact: Public Channel: https://t.me/+uRrdVo6k-CViYzg1 Private Telegram: https://t.me/MRBTCDAWEI Twitter [CryptoShelmes]: https://x.com/CryptoFuermos Official website of the world's mainstream virtual currency exchange-Bitunix-Register: https://www.bitunix.com/register?vipCode=6der (Risk reminder: All videos, only...
-

- Zito Realty Becomes First U.S. Real Estate Firm to Accept Pi Coin for Property Purchases
- May 22, 2025 at 12:40 am Pi mining TV
-

-
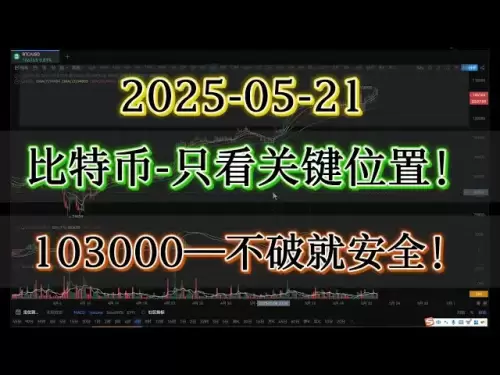
- The Bitcoin market is currently only focused on key positions! If 103000 is not broken, the disk will be safe! The opposite risk! Must-see! #crypto bitcoin #bitcoin#contract transaction
- May 22, 2025 at 12:35 am 宋建毅 -比特币分析
- #Bitcoin #Ethereum ETH This is an analysis channel about K-line financial product investment: mainly for #US stock analysis#tsla #smci #nvda #amd #amzn #google #metal #apple #bitcoin #bitcoin #Bitcoin #Gold #digital currency #stock analysis#US stocks#securities#gold#forex and futures trend analysis of financial products such as: #US stock analysis#tsla #smci #nvda #amd...
-

- BTC Danger? Where is the altcoin? NEIRO | PNUT | DOGE | ETH | PEPE | AAVE | TRUMP | BOME | Cryptocurrency | Copy Season | Virtual Coins
- May 22, 2025 at 12:35 am 卫央Neo - 投资物语
- 🙋♂️【Free Subscription Group】🙋 🎉 will receive notifications of sharing my transactions and video updates 🎉 ⬇️⬇️ Click the link below to join ⬇️⬇️⬇️✅【Free Subscription Group】✅ https://t.me/weiyangneo78 🙋♂️【Join the Fan Group】🙋 https://www.youtube.com/channel/UCXy7cYTLsZtux-i5AVqtiGw/join 📖【Join the Practical Member】📖 https://weiyangneo.com/...
-

- New Usdt Mining Site 2025 | UsdtInvestment Site 2025 |Tron Mining WebsiteUsdt Mining Website 2025
- May 22, 2025 at 12:30 am PERDAY EARNING
- orange Party - Ai Official website: https://nxnhdyesd.com/9660 The most popular Al quantitative money-making project in 2025 New user registration bonus 1. Orange Party - Ai Invite friends reward ...
-

- Stellar XLM Important Dates - Financial Astrology #xlm #stellar #xrp #ripple #cryptoastology
- May 22, 2025 at 12:30 am Melysid Tarot ve Astroloji
- ⭐Astrological counseling - https://www.melysid.com * ⭐Eğlenceli link - https://discord.gg/ulesid * video - https://www.youtube.com/watch?v=jq3ceud7ta8&t=274s * XLM COIN
-

- Bitcoin is just one step away from a new high! The copycat is ready to move, Binance Alpha is constantly new, the points intra-rolling intensifies, the chain's hype of pure memes is showing signs of fatigue, and it may gradually turn to application to
- May 22, 2025 at 12:25 am 加密克里斯
- Personal Twitter: https://twitter.com/CryptoKris666 Scan the chain of on-chain transactions Axiom: https://axiom.trade/@cryptok66 GMGN: https://gmgn.ai/?ref=NtZl14CJ&chain=sol VIP group entry consultation: https://t.me/Cryptokris666 Public telegram group: https://t.me/+a4TlhaYHY...