")


 |
|
 |
|
 |
|
 |
|
 |
|
 |
|
 |
|
 |
|
 |
|
 |
|
 |
|
 |
|
 |
|
 |
|
 |
|
Cryptocurrency News Video
6.6 Bitcoin fell by $5.000 as expected in the early morning. and the daily support pierced the bear market!
Jun 06, 2025 at 03:09 am 比特币队长Captain
Assistant's only telegram: bpq2020 (Note that bpq2020Msg is a liar!) Click the link to add Assistant's telegram: https://t.me/bpq2020 Bitcoin's real-time changes, what can be done is to analyze the next trend with a higher probability based on the current structure, and thus make a trading plan with a suitable profit-loss ratio. Generally, there is a top-bottom structure (double bottom, triangle, head and shoulder bottom, arc bottom, V bottom) which is easy for retail investors to identify and are likely to get out of the band. The pursuit of grabbing bands is the core password for continuous and stable outperforming the market. Summary of my 8 years of Bitcoin trading experience: superstitious analysis, blindly following operations, firm belief, high-powered Soha will definitely lose money as soon as possible! I wish all my friends who follow me good luck and always accompany you! [About the analysis timeline] 1H corresponds to a 1-3-day cycle, and the band corresponds to an amplitude of about US$2,000. 4H corresponds to a 7-20-day cycle, and the band corresponds to an amplitude of about US$5,000. The daily line corresponds to a 20-2-month cycle, and the band corresponds to an amplitude of about US$10,000. The weekly line corresponds to a 3-6-month cycle, and the band corresponds to an amplitude of about US$30,000. [About the analysis of common indicators] 1. Cloud diagram (one-picture balance table Ichimoku), default parameters, commonly used first-hand belt A and first-hand belt B. Use this indicator to determine the corresponding level of the top and bottom structure and the trend direction. This indicator is the main reference. In addition to searching for free indicator explanations on Youtube, we also have advanced paid course learning guidance. 2. MACD, the default parameter, is often used to judge deviation and assist in reference. 3. Trading volume is often used to judge the strength at the end of the trend and assist in reference. All the comments in this video and this article do not constitute any investment advice! For learning and communication only. #Bitcoin#Bitcoin Quotation#BTC#BTC#Crime Techniques#Crime Speculation Strategy#Crime Speculation Experience#Bitcoin Quotation#Captain Bitcoin#CaptainBTC#Bitcoin Mining#Bitcoin Captain#Bitcoin Captain
Disclaimer:info@kdj.com
The information provided is not trading advice. kdj.com does not assume any responsibility for any investments made based on the information provided in this article. Cryptocurrencies are highly volatile and it is highly recommended that you invest with caution after thorough research!
If you believe that the content used on this website infringes your copyright, please contact us immediately (info@kdj.com) and we will delete it promptly.
-

-

- Binance Red Packet code today|| Floki,2000 BTTC ,USDT, BTC, Ton , BNB Red Packet code today08 June
- Jun 08, 2025 at 04:25 pm @Saba Chorincles
- cryptocurrency, Binance Crypto red packet code today, Binance Red packet code, red packet, red packet code, red packet today, binance, today, Red Packet Code 28 April 2025, Red packet code airdrops...
-

- #pi node construction complete tutorial, suitable for everyone, novices can read #Pi Network #Pi Token #cryptocurrency #digital currency #blockchain #virtual currency #crypto economy #digital payment #financial innovation #pi mining #future currency #cryp
- Jun 08, 2025 at 04:20 pm 探索币圈
- Technical construction query plus VX: tanghuaijin002 Note: Pi node construction cheapest VPS: https://my.racknerd.com/aff.php?aff=14416 A minimum of USD 10.98 per year, a minimum of USD 0.33 per static residential agent: https://www.webshare.io/?referral_code=eicw1ucaci2l Cheap airport recommendation 1: https://llgjc1.com/#...
-

- Must watch this video, otherwise the losses will be heavy, and Bitcoin bulls will try many times to return? The bears have not been able to go down. Is the strength weakening or is the bulls really coming? Bitcoin Market Analysis #Ethereum Market Analysis
- Jun 08, 2025 at 04:20 pm 比特币·无名
- Public channel: t.me/sjzcwmgk6900 Private message link: https://t.me/BTC_WuMing #Bitcoin Contract#Big Coin Strategy#bitcoin #btc #Big Pie #eth #doge #Technical Analysis#Dow Theory#River Theory#Fibonacci#harmonic Form#Gann Theory#sol #ada #bnb #xrp #dot #avax #luna #uni #bitcoin News#Bitcoin Analysis#What is Bitcoin #Bitcoin#Ether#to...
-
- Wall Street Memes Coin Launch: The Next 10X Gem in Crypto?!
- Jun 08, 2025 at 04:15 pm 99BitcoinsCasinos
- 🔥- Download The Best Non-Custodial Crypto Wallet of 2025 to Safely Buy Crypto or Meme Coins With! - https://tinyurl.com/Best-Crypto-Wallet-No-KYC 💎- Bet Crypto or Meme Coins Safely with Lucky Block -...
-

- 6.8 Bitcoin Market Analysis | Bitcoin achieved V reverse return to the rising and falling position! The market is hitting the suppression range again. Can it fall under pressure and plummet again? Watch videos quickly to get ideas! Bitcoin Ethereum Ethere
- Jun 08, 2025 at 04:15 pm 比特币飞扬
- 💹Free group: https://t.me/feiyangkanbi 💹Telegram Telegram Private Chat: https://t.me/TraderFeiyang 💹Twitter: https://twitter.com/TraderFeiyang 💹Email: btcfeiyang@gmail.com If the telegram cannot send a private message, you can contact me on Twitter or email 👆👆👆 💹All opinions do not constitute any investment advice! For learning and communication only. #...
-

- Today's PI Network Info // 1000% Coin WPI can already be withdrawing the proof
- Jun 08, 2025 at 04:10 pm KAMPUNG CRYPTO JEMBER CHANNEL
- Join this channel to get access to various advantages: https://www.youtube.com/channel/ucunqltmbugoql9lvkzirrw/join Pi Network Today, Latest Pi Network Today, News Pi ...
-
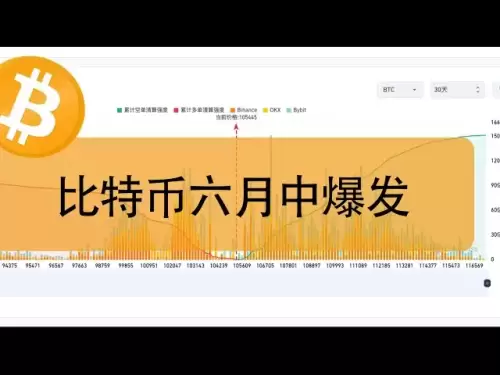
- Will Bitcoin surge in mid-June? 150,000 short list clearing and a signal of surge in global M2 liquidity!
- Jun 08, 2025 at 04:10 pm 区块链kk320
- YouTube video title: Will Bitcoin surge in mid-June? 150,000 short list clearing and a signal of surge in global M2 liquidity! Video introduction: 🔥 Hot news in the Bitcoin market! The clearing map shows that 150,000 short positions have accumulated at key prices, and global M2 liquidity continues to be high, and various signs point to a strong increase in mid-June! 📈 In this video, we will conduct in-depth analysis of clearing map data, global liquidity trends and potential trends of Bitcoin prices, to give you insight into market trends! 💡 Don’t forget to subscribe and turn on the small bell to get the latest crypto market updates! 🚀 ...
-