 |
|
 |
|
 |
|
 |
|
 |
|
 |
|
 |
|
 |
|
 |
|
 |
|
 |
|
 |
|
 |
|
 |
|
 |
|
Cryptocurrency News Articles
Bitcoin (BTC) Prepares for a Steep Correction as XRP Lags the Market
May 24, 2025 at 08:01 am
With its recent all-time high of almost $112,000, Bitcoin has sent the market into a state of euphoria.

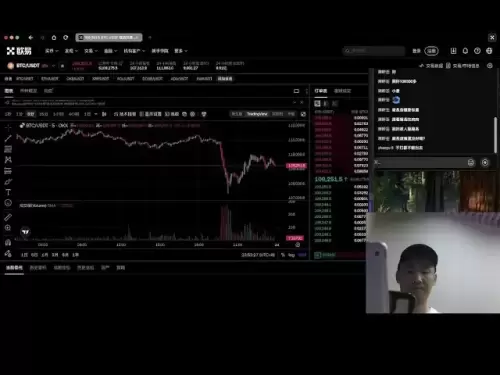
Bitcoin price today is showing signs of exhaustion at the same rate it rose. The top cryptocurrency is now displaying the potential for a reversal on the daily chart.
As the crypto market hits new all-time highs, it is also exhibiting signs of fatigue, especially in Bitcoin's price action. After reaching a high of $111,900, the price has pulled back below $110,000.
At the same time, volume is beginning to decrease, which may signal an impending deeper correction. Moreover, the Relative Strength Index (RSI) is trending lower from overbought levels above 70.
If Bitcoin loses $107,000-$108,000, it might return to the $102,000 breakout point. If that support were broken, then the bearish momentum would probably get stronger.
The technical risk is compounded by a major macroeconomic development. On June 1, 2025, a new 50% tariff on goods imported from the EU is scheduled to go into effect. The measure is intended to address alleged trade imbalances.
It may also spark a round of economic reprisals from EU countries. This increases the level of uncertainty for global risk assets such as cryptocurrency and raises the possibility of capital flight from unstable positions.
A tariff war, however, might harm liquidity and halt institutional appetite in this situation. Bitcoin may not be safe from geopolitical pressure if capital moves into safer asset classes or if conventional markets falter. In fact, it might be particularly susceptible to a steep correction given the speculative nature of its current rally.
A steeper pulldown could be triggered by a weakening trend, dropping volume and increasing trade-related macro tension. Traders should closely monitor the $102,000 level because a crash landing could end the post-ATH party if it breaks.
As Bitcoin continues to take center stage and advance into new markets, XRP appears to be lagging behind, failing to capitalize on the broad optimism in the cryptocurrency market.
Despite technically recovering its key exponential moving averages and breaking out of its descending channel, the momentum in XRP has stalled, especially in contrast to Bitcoin’s dramatic rally.
With bullish structure still present, albeit marginally, XRP is currently trading at $2.45 and has formed a local support zone between $2.30 and $2.35.
Although the price action has moved above the 100- and 200-day EMAs, it is still lumpy and cautious. There is little indication that a breakout push is imminent with the RSI ranging around neutral and volume levels fail to sustain a long-term rally.
One of the main factors hindering XRP is the increasing market dominance of Bitcoin. As Bitcoin’s dominance increases, altcoins tend to lose capital. In times of high dominance, typically Bitcoin becomes the main driver of cryptocurrency capital flows, leaving altcoins like XRP to struggle for inflows.
This dynamic explains why XRP can hardly sustain post- breakout gains, while Bitcoin is easily testing higher prices around $111,000. It is also putting pressure on the broader altcoin market.
Several layer 1s and DeFi tokens are lagging, failing to sustain their breakouts or gain traction. With its regulatory baggage and lumpy on-chain metrics, XRP is not a top candidate to benefit from the current risk-on cycle, and Bitcoin’s gravitational pull is stifling the alt season narrative.
Unless BTC plateaus and its dominance decreases, XRP may continue to lag. For now, XRP is still on the sidelines of the bull market party, but that could change with a strong volume surge and a reclaiming of $2.60.
As the price of Solana approaches the psychological level of $200, it is showing clear signs of renewed momentum.
The asset has recently broken out of a short-term consolidation pattern, confirming the strength of the local uptrend. More importantly, technical indicators are beginning to show interesting signals that could support the next leg up if the right conditions arise.
Among the most interesting developments is the 26-day EMA crossing above several key moving averages, including the 50 and 100 EMAs.
Although it is not a golden cross in the traditional sense, this crossover is still a significant indication of increasing local momentum. It showcases short-term strength and heightened interest, which could serve as the basis for a sustained rally towards $200.
However, the broader context suggests some caution. The 200 EMA, in particular, and the longer-term moving averages are still lagging behind the current price action.
For instance, to maintain the bullish structure, these lagging indicators need to start turning upwards and close the gap with the spot price. Additionally, the volume patterns support the breakout.
As the 26-day EMA meets the 50-day EMA, signaling a short-term apex in
Disclaimer:info@kdj.com
The information provided is not trading advice. kdj.com does not assume any responsibility for any investments made based on the information provided in this article. Cryptocurrencies are highly volatile and it is highly recommended that you invest with caution after thorough research!
If you believe that the content used on this website infringes your copyright, please contact us immediately (info@kdj.com) and we will delete it promptly.
-

-

-

-

-

- Starting in January of next year (2026), Form 1099-DA will reshape the way cryptocurrency income is reported to the IRS.
- May 24, 2025 at 04:40 pm
- In this guide, we'll explain what Form 1099-DA is, how it will affect centralized and decentralized exchanges, and the steps you can take to stay proactive.
-

-

-

-


