


-
 bitcoin
 $87959.907984 USD
1.34% - ethereum
$2920.497338 USD
3.04% - tether
$0.999775 USD
0.00% - xrp
$2.237324 USD
8.12% - bnb
$860.243768 USD
0.90% - solana
$138.089498 USD
5.43% - usd-coin
$0.999807 USD
0.01% - tron
$0.272801 USD
-1.53% - dogecoin
$0.150904 USD
2.96% - cardano
$0.421635 USD
1.97% - hyperliquid
$32.152445 USD
2.23% - bitcoin-cash
$533.301069 USD
-1.94% - chainlink
$12.953417 USD
2.68% - unus-sed-leo
$9.535951 USD
0.73% - zcash
$521.483386 USD
-2.87%


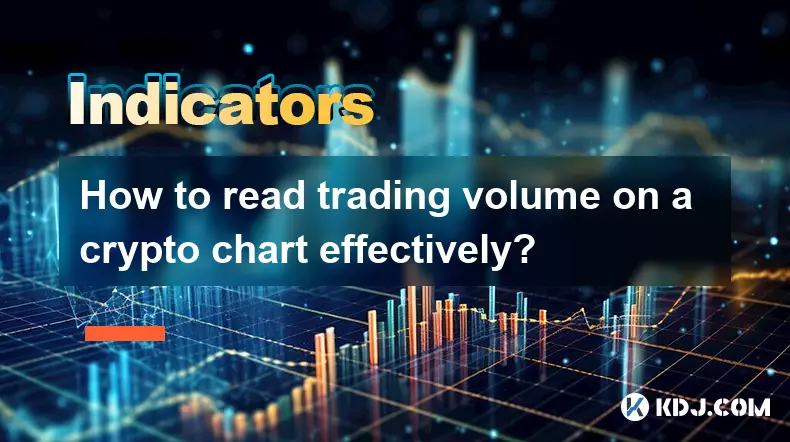
How to read trading volume on a crypto chart effectively?
Volume bars beneath price charts reflect trade activity—height shows volume, color hints at buying/selling pressure, and spikes confirm breakouts or reversals when aligned with price action.
Jan 21, 2026 at 07:19 pm
Understanding Volume Bars and Their Positioning
1. Volume bars appear directly beneath the price chart, usually as vertical rectangles aligned with each candlestick or time interval.
2. Height reflects the total number of tokens traded during that period—taller bars indicate higher activity, shorter ones signal consolidation or apathy.
3. Color coding often distinguishes buying versus selling pressure; green may represent net inflows while red shows net outflows, though this varies by platform.
4. Some interfaces overlay volume-weighted average price (VWAP) lines to highlight where most liquidity resides across timeframes.
5. Volume spikes coinciding with breakouts or breakdowns carry more validity than isolated surges without price confirmation.
Interpreting Volume in Relation to Price Action
1. A strong upward move accompanied by rising volume suggests institutional accumulation or broad-based bullish conviction.
2. Declining volume during a sustained rally hints at exhaustion—fewer participants are willing to buy at current levels.
3. Sharp price drops with heavy volume often reflect capitulation or forced liquidations, especially near key support zones.
4. Sideways price movement with expanding volume signals building tension—traders are actively positioning ahead of an imminent directional move.
5. Fakeouts frequently occur when volume dries up during a breakout attempt, exposing thin order book depth and low follow-through.
Comparing Volume Across Timeframes
1. Daily volume provides context for macro sentiment, while 15-minute or hourly charts reveal intraday participation shifts.
2. A weekly high-volume rejection at resistance carries more weight than repeated daily retests with diminishing turnover.
3. Volume divergence emerges when price makes new highs but volume fails to exceed prior peaks—this warns of weakening momentum.
4. Multi-timeframe alignment—such as elevated volume on both 4-hour and daily charts during a reversal pattern—increases reliability.
5. Exchange-specific volume discrepancies matter: Binance volume may differ significantly from Bybit or OKX due to native token incentives or regional user bases.
Volume Profile and Key Levels
1. Volume profile displays horizontal layers showing where the most trading occurred vertically across price—not time—revealing high-volume nodes (HVN) and low-volume gaps (LVG).
2. HVNs act as magnet zones where price tends to return due to liquidity concentration and prior participant memory.
3. LVGs often become targets for rapid price acceleration since minimal resting orders exist to absorb momentum.
4. Point of Control (POC), the price level with highest volume in a selected range, serves as dynamic support/resistance in ranging markets.
5. Volume profile skew—where most volume clusters above or below POC—indicates directional bias even before price confirms it.
Frequently Asked Questions
Q: Does high volume always mean a trend will continue?Not necessarily. High volume during a reversal candle—like a bearish engulfing pattern at resistance—can mark the start of a trend change rather than continuation.
Q: Can volume be manipulated on crypto exchanges?Yes. Wash trading, ticker stuffing, and volume inflation through bot networks remain documented issues, particularly on smaller platforms lacking third-party audit verification.
Q: Why does volume sometimes look different across charting tools like TradingView and exchange-native charts?Differences arise from data sources—some aggregators include only spot volume, others add futures notional value, and certain platforms exclude canceled orders or quote currency conversions.
Q: Is volume less relevant for low-cap altcoins?Volume is actually more critical for low-cap assets because thin order books amplify slippage and make them vulnerable to pump-and-dump schemes—low volume here increases execution risk dramatically.
Disclaimer:info@kdj.com
The information provided is not trading advice. kdj.com does not assume any responsibility for any investments made based on the information provided in this article. Cryptocurrencies are highly volatile and it is highly recommended that you invest with caution after thorough research!
If you believe that the content used on this website infringes your copyright, please contact us immediately (info@kdj.com) and we will delete it promptly.


- Bitcoin, eCash Fork, and Airdrop Dynamics: A Deep Dive into Crypto's Latest Controversies
- 2026-05-03 12:55:01
- Consensus 2026 Miami: Web3, Blockchain, Cryptocurrency, NFTs, Metaverse, Conference, May 5th — Where Wall Street Meets the Digital Frontier
- 2026-05-02 12:45:01
- Fed Holds Rates Steady, Triggering Bitcoin Price Drop Amidst Geopolitical Tensions
- 2026-05-01 06:45:01
- Bitcoin Miners Electrify the Grid: Ohio Gas Plant Acquisition Powers Up a New Era for Digital Gold
- 2026-05-01 00:45:01
- MegaETH's MEGA Token Hits the Big Apple: Setting New Performance Benchmarks for Real-Time Blockchain
- 2026-05-01 00:55:01
- Solana's Slippery Slope: Price Prediction Points to Resistance Loss and Potential Further Drops
- 2026-05-01 06:45:01
Related knowledge

What Is Crypto Bottom Indicator? How Do Traders Identify Market Lows?
Jul 21,2026 at 08:20am
Bitcoin Halving Mechanics1. Bitcoin’s protocol enforces a fixed issuance schedule where block rewards are cut in half approximately every 210,000 bloc...

What Is Crypto Trend Reversal Indicator? Which Signals Should You Watch?
Jul 24,2026 at 11:00am
Market Volatility Patterns1. Bitcoin price swings often exceed 5% within a single 24-hour window during high-liquidity events such as ETF inflow annou...

What Is Weekly Bitcoin Chart Indicator? Can It Predict Long-Term Trends?
Jul 22,2026 at 07:39am
Market Volatility Patterns1. Price swings in cryptocurrency markets often exceed 10% within a 24-hour window, driven by liquidity constraints and algo...

What Is 4 Hour Chart Indicator? Why Do Crypto Traders Use It?
Jul 23,2026 at 02:20pm
Market Volatility Patterns1. Bitcoin price swings often exceed 10% within a 24-hour window during high-liquidity events such as ETF approval announcem...

What Is Premium Index Indicator? Why Does It Matter in Futures Trading?
Jul 23,2026 at 06:59pm
Premium Index Definition and Composition1. The Premium Index is a real-time metric derived from the weighted average price difference between perpetua...

What Is Basis Indicator in Crypto Futures? How Do Traders Use It?
Jul 20,2026 at 11:59pm
Basis Indicator Definition and Core Mechanics1. The basis indicator measures the price difference between a cryptocurrency’s spot price and its corres...
What Is Crypto Bottom Indicator? How Do Traders Identify Market Lows?
Jul 21,2026 at 08:20am
Bitcoin Halving Mechanics1. Bitcoin’s protocol enforces a fixed issuance schedule where block rewards are cut in half approximately every 210,000 bloc...
What Is Crypto Trend Reversal Indicator? Which Signals Should You Watch?
Jul 24,2026 at 11:00am
Market Volatility Patterns1. Bitcoin price swings often exceed 5% within a single 24-hour window during high-liquidity events such as ETF inflow annou...
What Is Weekly Bitcoin Chart Indicator? Can It Predict Long-Term Trends?
Jul 22,2026 at 07:39am
Market Volatility Patterns1. Price swings in cryptocurrency markets often exceed 10% within a 24-hour window, driven by liquidity constraints and algo...
What Is 4 Hour Chart Indicator? Why Do Crypto Traders Use It?
Jul 23,2026 at 02:20pm
Market Volatility Patterns1. Bitcoin price swings often exceed 10% within a 24-hour window during high-liquidity events such as ETF approval announcem...
What Is Premium Index Indicator? Why Does It Matter in Futures Trading?
Jul 23,2026 at 06:59pm
Premium Index Definition and Composition1. The Premium Index is a real-time metric derived from the weighted average price difference between perpetua...
What Is Basis Indicator in Crypto Futures? How Do Traders Use It?
Jul 20,2026 at 11:59pm
Basis Indicator Definition and Core Mechanics1. The basis indicator measures the price difference between a cryptocurrency’s spot price and its corres...
See all articles


