


")


-
 bitcoin
 $87959.907984 USD
1.34% - ethereum
$2920.497338 USD
3.04% - tether
$0.999775 USD
0.00% - xrp
$2.237324 USD
8.12% - bnb
$860.243768 USD
0.90% - solana
$138.089498 USD
5.43% - usd-coin
$0.999807 USD
0.01% - tron
$0.272801 USD
-1.53% - dogecoin
$0.150904 USD
2.96% - cardano
$0.421635 USD
1.97% - hyperliquid
$32.152445 USD
2.23% - bitcoin-cash
$533.301069 USD
-1.94% - chainlink
$12.953417 USD
2.68% - unus-sed-leo
$9.535951 USD
0.73% - zcash
$521.483386 USD
-2.87%


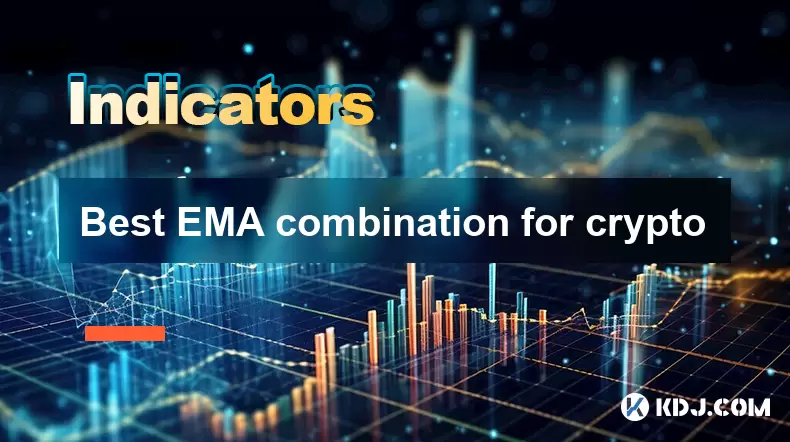
Best EMA combination for crypto
The Exponential Moving Average (EMA) helps crypto traders identify trends and reversals by prioritizing recent price data, offering quicker insights than the Simple Moving Average (SMA).
Jul 13, 2025 at 06:07 am
Understanding the Role of EMA in Cryptocurrency Trading
The Exponential Moving Average (EMA) is a vital technical analysis tool used by traders to identify trends and potential reversal points in cryptocurrency markets. Unlike the Simple Moving Average (SMA), EMA gives more weight to recent price data, making it more responsive to new information. In the fast-moving world of crypto, where volatility is common, using EMA can help traders make quicker and more informed decisions.
Traders often combine multiple EMAs to filter out noise and confirm trend directions. The best EMA combinations for crypto depend on trading style, time frame, and market conditions. Short-term traders may prefer faster EMAs, while long-term investors might rely on slower ones.
Important: Always backtest your strategy before applying it in live trading environments.
Popular EMA Combinations Used in Crypto Trading
Among the most commonly used EMA combinations in crypto are:
- 9-period and 21-period EMA: This combination works well for intraday or swing traders who aim to capture short-to-medium term moves.
- 50-period and 200-period EMA: Often used by long-term investors to determine major trend reversals and strength.
- 12-period and 26-period EMA: These are foundational components of the MACD indicator and are effective in identifying momentum shifts.
Each combination has its strengths and weaknesses. For example, shorter EMAs like the 9 and 21 are more sensitive to price changes and may generate more signals, but also more false ones during choppy markets.
Key Insight: Combining EMAs with other indicators such as RSI or volume can enhance accuracy.
How to Apply the 9 and 21 EMA Strategy in Crypto Charts
To implement the 9 and 21 EMA crossover strategy, follow these steps:
- Open your preferred charting platform (e.g., TradingView).
- Add two EMA overlays: one set at 9 and another at 21.
- Watch for crossovers: when the 9 EMA crosses above the 21 EMA, it signals a potential uptrend (buy signal). Conversely, a cross below indicates a downtrend (sell signal).
- Confirm the signal with candlestick patterns or volume spikes for better reliability.
This strategy works particularly well in trending markets and less so in sideways consolidations.
Caution: Avoid relying solely on EMA crossovers without additional confirmation tools.
Using 50 and 200 EMA for Long-Term Crypto Positioning
For long-term traders, the 50 and 200 EMA combination provides a broader view of market direction. Known as the 'Golden Cross' (when 50 crosses above 200) and 'Death Cross' (when 50 crosses below 200), these events have historically signaled significant market shifts in assets like Bitcoin and Ethereum.
To use this strategy:
- Apply both EMAs on a daily or weekly chart.
- Monitor the relationship between the two lines over time.
- Enter long positions after a Golden Cross is confirmed with rising volume.
- Consider exiting or hedging positions after a Death Cross appears.
While powerful, these signals can lag due to their long periods, meaning they may not be suitable for day traders.
Pro Tip: Combine with fundamental analysis for stronger conviction in long-term trades.
Customizing EMA Settings Based on Market Conditions
There's no one-size-fits-all EMA combination for all cryptocurrencies or market conditions. Traders should adjust EMA settings based on:
- Volatility: More volatile coins like altcoins may benefit from tighter EMAs (e.g., 7 and 15).
- Timeframe: Day traders might use 5-minute or 15-minute charts with faster EMAs, while weekly charts suit slower EMAs.
- Liquidity: Low-liquidity tokens may produce erratic signals; hence, smoothing with longer EMAs could help.
It’s essential to experiment with different values and observe how they perform across various market cycles.
Remember: Optimization should always be done with historical data and validated through paper trading.
Frequently Asked Questions
Q: Can I use EMA alone for trading crypto?A: While EMA is a strong indicator, using it in isolation may lead to misleading signals. It’s best combined with volume, support/resistance levels, or oscillators like RSI.
Q: What timeframes work best with EMA strategies?A: Shorter EMAs like 9 and 21 are ideal for 1-hour or 4-hour charts, while 50 and 200 EMAs are better suited for daily or weekly charts.
Q: How do I know which EMA combination suits my trading style?A: Start by defining your goals—whether you're scalping, day trading, or holding long-term. Then test different combinations using backtesting tools available on platforms like TradingView.
Q: Is EMA better than SMA for crypto trading?A: EMA reacts faster to price changes, which can be beneficial in fast-moving crypto markets. However, SMA may offer fewer false signals in ranging markets.
Disclaimer:info@kdj.com
The information provided is not trading advice. kdj.com does not assume any responsibility for any investments made based on the information provided in this article. Cryptocurrencies are highly volatile and it is highly recommended that you invest with caution after thorough research!
If you believe that the content used on this website infringes your copyright, please contact us immediately (info@kdj.com) and we will delete it promptly.


- Bitcoin, eCash Fork, and Airdrop Dynamics: A Deep Dive into Crypto's Latest Controversies
- 2026-05-03 12:55:01
- Consensus 2026 Miami: Web3, Blockchain, Cryptocurrency, NFTs, Metaverse, Conference, May 5th — Where Wall Street Meets the Digital Frontier
- 2026-05-02 12:45:01
- Fed Holds Rates Steady, Triggering Bitcoin Price Drop Amidst Geopolitical Tensions
- 2026-05-01 06:45:01
- Bitcoin Miners Electrify the Grid: Ohio Gas Plant Acquisition Powers Up a New Era for Digital Gold
- 2026-05-01 00:45:01
- MegaETH's MEGA Token Hits the Big Apple: Setting New Performance Benchmarks for Real-Time Blockchain
- 2026-05-01 00:55:01
- Solana's Slippery Slope: Price Prediction Points to Resistance Loss and Potential Further Drops
- 2026-05-01 06:45:01
Related knowledge

What Is Crypto Top Indicator? Which Signals Show a Market Peak?
Jul 30,2026 at 06:59pm
Understanding Crypto Top Indicators1. Crypto top indicators are statistical tools designed to identify exhaustion points in upward price momentum befo...

What Is Crypto Bottom Indicator? How Do Traders Identify Market Lows?
Jul 21,2026 at 08:20am
Bitcoin Halving Mechanics1. Bitcoin’s protocol enforces a fixed issuance schedule where block rewards are cut in half approximately every 210,000 bloc...

What Is Early Warning Indicator for Crypto Price Drops?
Aug 02,2026 at 03:30am
Market Volatility Patterns1. Bitcoin price movements often exhibit sharp intraday swings exceeding 5% during major macroeconomic announcements. 2. Alt...

What Is Crypto Trend Reversal Indicator? Which Signals Should You Watch?
Jul 24,2026 at 11:00am
Market Volatility Patterns1. Bitcoin price swings often exceed 5% within a single 24-hour window during high-liquidity events such as ETF inflow annou...

What Is Weekly Bitcoin Chart Indicator? Can It Predict Long-Term Trends?
Jul 22,2026 at 07:39am
Market Volatility Patterns1. Price swings in cryptocurrency markets often exceed 10% within a 24-hour window, driven by liquidity constraints and algo...

What Is Daily K Line Indicator? How Do You Analyze Daily Trends?
Jul 29,2026 at 09:06pm
Market Volatility Patterns1. Bitcoin price swings often exceed 10% within a 24-hour window during high-liquidity events such as ETF approval announcem...
What Is Crypto Top Indicator? Which Signals Show a Market Peak?
Jul 30,2026 at 06:59pm
Understanding Crypto Top Indicators1. Crypto top indicators are statistical tools designed to identify exhaustion points in upward price momentum befo...
What Is Crypto Bottom Indicator? How Do Traders Identify Market Lows?
Jul 21,2026 at 08:20am
Bitcoin Halving Mechanics1. Bitcoin’s protocol enforces a fixed issuance schedule where block rewards are cut in half approximately every 210,000 bloc...
What Is Early Warning Indicator for Crypto Price Drops?
Aug 02,2026 at 03:30am
Market Volatility Patterns1. Bitcoin price movements often exhibit sharp intraday swings exceeding 5% during major macroeconomic announcements. 2. Alt...
What Is Crypto Trend Reversal Indicator? Which Signals Should You Watch?
Jul 24,2026 at 11:00am
Market Volatility Patterns1. Bitcoin price swings often exceed 5% within a single 24-hour window during high-liquidity events such as ETF inflow annou...
What Is Weekly Bitcoin Chart Indicator? Can It Predict Long-Term Trends?
Jul 22,2026 at 07:39am
Market Volatility Patterns1. Price swings in cryptocurrency markets often exceed 10% within a 24-hour window, driven by liquidity constraints and algo...
What Is Daily K Line Indicator? How Do You Analyze Daily Trends?
Jul 29,2026 at 09:06pm
Market Volatility Patterns1. Bitcoin price swings often exceed 10% within a 24-hour window during high-liquidity events such as ETF approval announcem...
See all articles


