 |
|
 |
|
 |
|
 |
|
 |
|
 |
|
 |
|
 |
|
 |
|
 |
|
 |
|
 |
|
 |
|
 |
|
 |
|
技術分析師Whales_crypto_trading已確定了Hedera的日常時間範圍的下降楔形模式,HBAR從下邊界反彈

As broader market sentiment begins to shift, analysts are watching HBAR price trend and smart contract utility for signs of renewed upside potential.
隨著更廣泛的市場情緒開始轉移,分析師正在關注HBAR價格趨勢和智能合約實用程序,以示上上升潛力的跡象。
HBAR Price Falling Wedge Breakout Signal Reversal Potential
HBAR價格下跌楔形突破信號反轉潛力
Technical analyst Whales_Crypto_Trading is highlighting a falling wedge pattern on Hedera’s daily timeframe, with HBAR rebounding from the lower boundary near the $0.045–$0.047 support zone. This pattern, typically recognized as a bullish reversal signal, emerges following a prolonged downtrend, rendering it a noteworthy development. A breakout above the wedge resistance, ideally accompanied by increased volume, would signal the beginning of a trend reversal.
技術分析師Whales_crypto_trading強調了Hedera的日常時間表上的楔形圖案,HBAR在$ 0.045- $ 0.047支撐區附近反彈。這種模式通常被認為是看漲的逆轉信號,在長期下降趨勢之後出現,使其成為一個值得注意的發展。楔形阻力上方的突破,理想地伴隨著增加體積,這表明趨勢逆轉的開始。
This could be a significant development, especially if we consider that HBAR price has been struggling to break out of a multi-year trading range. A breakout from the wedge, if confirmed, might indicate that sellers are exhausting themselves, allowing buyers to step in and drive the price higher.
這可能是一個重大的發展,尤其是如果我們認為HBAR價格一直在努力擺脫多年交易範圍。如果確認,楔形的突破可能表明賣家正在筋疲力盡,使買家可以介入並提高價格。
The daily chart also shows HBAR approaching its 50-day moving average, which currently acts as dynamic resistance. A close above this moving average would further reinforce the bullish outlook. Volume analysis through the Volume Profile Visible Range (VPVR) identifies the $0.062–$0.063 zone as the first target, marked by historical trading activity.
每日圖表還顯示,HBAR接近其50天移動平均線,目前充當動態阻力。超過這一移動平均線的接近將進一步加強看漲的前景。通過音量概況可見範圍(VPVR)的體積分析將$ 0.062– $ 0.063的區域標識為第一個目標,標有歷史交易活動。
Beyond this level lies a low-volume zone extending to $0.090, which could allow the price to accelerate more rapidly if it enters that range.
超出此級別的低量區域延伸至$ 0.090,如果它進入該範圍,這可以使價格更快地加速。
Higher targets of $0.090 and $0.120 have been identified based on historical resistance zones and prior market structure. This technical setup indicates that while HBAR is still in the early stages of a possible reversal, there is potential for broader gains if buyers continue to defend current support levels. However, a move below $0.045 would invalidate the pattern and shift momentum back in favor of sellers.
基於歷史阻力區和先前的市場結構,已經確定了0.090美元和0.120美元的較高目標。該技術設置表明,儘管HBAR仍處於可能的逆轉的早期階段,但如果買家繼續捍衛當前的支持水平,則可能會取得更大的收益。但是,低於$ 0.045的舉動將使模式無效,並轉移動量反對賣家。
Hedera Price Prediction: Smart Contract Utility and Market Structure Support
HEDERA價格預測:智能合同公用事業和市場結構支持
In addition, Hedera (HBAR) price is currently at $0.19, reflecting a modest 0.33% increase over the last 24 hours. It reached an intraday high near $0.195 before retreating slightly, suggesting short-term bullish activity. The 24-hour trading volume is approximately $144.9 million, indicating active participation, with a total market capitalization of around $8.22 billion.
此外,Hedera(HBAR)的價格目前為0.19美元,反映了過去24小時的0.33%。在稍微退縮之前,它達到了額外的額外高度$ 0.195,這表明短期看漲活動。 24小時的交易量約為1.449億美元,表明積極參與,總市值約為82.2億美元。
These figures suggest a healthy level of investor engagement, likely influenced by recent technical signals and ongoing developments in the network’s utility.
這些數字表明,投資者參與度的健康水平很可能受到網絡公用事業中最近的技術信號和持續發展的影響。
One of Hedera’s core strengths lies in its enterprise-grade architecture and governance. The Hedera Consensus Service (HCS) provides timestamping and verifiable data recording for decentralized applications, making it suitable for use cases across supply chains, finance, and digital identity.
Hedera的核心優勢之一在於其企業級建築和治理。 Hedera共識服務(HCS)為分散應用程序提供時間戳和可驗證的數據記錄,使其適用於跨供應鏈,金融和數字身份的用例。
The network is governed by a global council of established organizations, including Google, IBM, LG, and Deutsche Telekom. This governance model provides transparency and trust, which are important considerations for institutional adoption.
該網絡由包括Google,IBM,LG和Deutsche Telekom在內的全球成熟組織委員會約束。這種治理模型提供了透明度和信任,這是機構採用的重要考慮因素。
According to Brave New Coin, investor interest in Hedera appears to be increasing as the network’s ecosystem expands. The smart contract platform’s capacity to handle high throughput with low fees has positioned it as a preferred option for developers seeking alternatives to Ethereum’s high transaction costs. As adoption broadens across multiple sectors, HBAR price valuation may be influenced not just by speculation but also by sustained utility-driven demand.
根據Brave New Coin的說法,隨著網絡的生態系統的擴展,投資者對Hedera的興趣似乎正在增加。 Smart Contract平台處理高費用高通量的能力將其定位為尋求以太坊高交易成本替代方案的開發人員的首選選擇。隨著多個領域的採用範圍擴大,HBAR價格估值不僅可能受到投機的影響,而且還受持續的公用事業驅動需求的影響。
Hedera Price Prediction: Weekly Technical Analysis Points to Accumulation Phase
Hedera價格預測:每週技術分析指向累積階段
The weekly chart of Hedera (HBAR/USDT) presents a mixed picture. The current trading price stands at $0.19537, showing a slight decline of 0.80% for the ongoing weekly candle. Despite retracing from a local high of approximately $0.31, the price has managed to remain above its recent multi-week lows.
Hedera(HBAR/USDT)的每週圖表呈現出混合圖片。目前的交易價格為0.19537美元,正在進行的每週蠟燭的略有下降0.80%。儘管從當地高點重達約0.31美元,但價格仍然超過了其最近的多周低點。
More so, presence of candles with small bodies and long upper and lower wicks indicates a state of indecision among market participants.
更重要的是,有小身體和長上下燈芯的蠟燭的存在表明市場參與者的猶豫不決。
A key technical indicator in the weekly outlook is the Chaikin Money Flow (CMF), which currently reads -0.25. This negative value indicates net capital outflows from HBAR and suggests limited buying pressure from institutional or large-scale traders. Historically, a CMF reading below -0.20 is considered bearish and may point to sellers dominating the market during recent price rallies.
每週前景中的關鍵技術指標是Chaikin貨幣流(CMF),目前讀取-0.25。該負值表明HBAR的淨資本流出,這表明從機構或大型交易員那裡購買壓力有限。從歷史上看,低於-0.20的CMF讀數被認為是看跌,可能指向賣方在最近的價格集會期間主導著市場。
Nonetheless, HBAR price appears to be forming a support base in the $0.18–$0.19 range. This zone has seen repeated buying interest, indicating that market participants may be accumulating at these levels.
儘管如此,HBAR價格似乎仍在$ 0.18- $ 0.19範圍內形成支持基礎。該區域已經重複購買興趣,表明市場參與者可能會在這些水平上積累。
To confirm a shift in long-term trend, however, the price would need to close above the $0.21–$0.22 resistance zone and ultimately break past $0.31 to revisit prior highs. Until such moves occur, the broader trend remains neutral to slightly bearish, requiring confirmation from volume and breakout patterns to shift
但是,為了確認長期趨勢的轉變,價格將需要超過0.21至0.22美元的電阻區,並最終超過0.31美元以重新訪問先前的高點。在此類移動發生之前,更廣泛的趨勢保持中性至略微看跌,需要從體積和突破模式進行確認才能轉移
免責聲明:info@kdj.com
所提供的資訊並非交易建議。 kDJ.com對任何基於本文提供的資訊進行的投資不承擔任何責任。加密貨幣波動性較大,建議您充分研究後謹慎投資!
如果您認為本網站使用的內容侵犯了您的版權,請立即聯絡我們(info@kdj.com),我們將及時刪除。
-

-

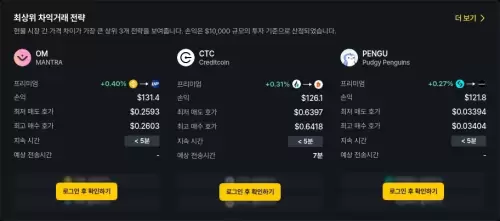
- 套利冒險:信用額,卡巴和追逐加密貨幣利潤
- 2025-08-03 20:01:53
- 參與信用量(CTC)和Kaspa(KAS)套利的世界套利世界,探索實時市場效率低下的機會和風險。
-

- Claude Hive&Code Agents:更快的編碼革命?
- 2025-08-03 20:01:35
- 發現Claude Hive和AI驅動的代碼代理如何使用更快,更有效的工作流重新定義軟件開發。
-

- 特朗普媒體,比特幣和加密貨幣:製作中令人驚訝的聯盟?
- 2025-08-03 19:59:22
- 潛入特朗普媒體,比特幣和加密世界的交集。特朗普媒體大膽地轉向比特幣改變遊戲規則,還是另一個標題?
-

- 在市場不確定性的情況下,Shiba Inu的看漲逆轉希望:深度潛水
- 2025-08-03 19:54:11
- 什巴INU能否抗拒市場不確定性和看漲的逆轉?分析技術信號,鏈上數據和更廣泛的SHIB市場趨勢。
-

- XRP,Ripple和法律審查:導航加密雷區
- 2025-08-03 19:51:54
- 解碼XRP的所有權,市場移動和法律鬥爭。 Ripple的騎行會變得顛簸嗎,還是只是紐約一分鐘的加密混亂?
-

-

- Solana的下一章:SOL預測和SOLF代幣嗡嗡聲
- 2025-08-03 18:01:14
- 探索Solana(Sol)達到新高度的潛力,這是由於Solf代幣周圍的嗡嗡聲及其對SPL社區的潛在影響。
-


