 |
|
 |
|
 |
|
 |
|
 |
|
 |
|
 |
|
 |
|
 |
|
 |
|
 |
|
 |
|
 |
|
 |
|
 |
|
Market Analyst CWが共有するチャート分析によると、Dogecoin(Doge)は大幅な価格移動の危機にonしている可能性があります。

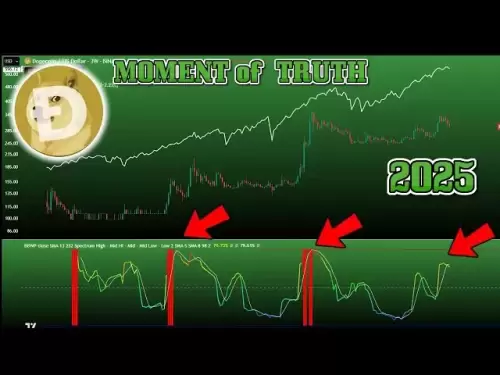
Dogecoin (DOGE) may be on the verge of a significant price move, according to chart analysis shared by market analyst CW, who is known for spotting convergence breakout patterns. In a May 18 post, CW posted a 4-hour chart of DOGE/USDT showing a descending triangle formation, often considered a precursor to a breakout.
Dogecoin(Doge)は、収束ブレイクアウトパターンを発見することで知られているMarket Analyst CWが共有するチャート分析によると、大幅な価格移動の危機にonしている可能性があります。 5月18日の投稿で、CWは、下の三角形の形成を示すDoge/USDTの4時間のチャートを投稿しました。
The triangle pattern is forming with a series of lower highs and steady support around the $0.215 level. This structure signals a squeeze in price action, which typically results in a sharp move once a breakout occurs. CW's chart shows that the price is nearing the apex of the triangle, suggesting a decisive breakout could happen soon.
三角形のパターンは、0.215ドルのレベルで一連の低い高値と着実なサポートで形成されています。この構造は、価格アクションの絞りを示します。これは、通常、ブレイクアウトが発生すると鋭い動きをもたらします。 CWのチャートは、価格が三角形の頂点に近づいていることを示しており、決定的なブレイクアウトがすぐに発生する可能性があることを示唆しています。
"Short-term convergence breakout of DOGE is imminent," CW said.
「Dogeの短期的な収束ブレイクアウトは差し迫っています」とCWは言いました。
According to the analyst, a break above the triangle's resistance line could push DOGE up toward $0.306. This target is based on the height of the triangle, measured from the widest point of the pattern and added to the breakout level.
アナリストによると、三角形の抵抗ラインの上のブレークは、Dogeを0.306ドルに押し上げる可能性があります。このターゲットは、パターンの最も広いポイントから測定され、ブレイクアウトレベルに追加された三角形の高さに基づいています。
"If the convergence breakout is achieved, further rise to the $0.306 level is possible," CW noted.
「収束ブレイクアウトが達成された場合、さらに0.306ドルのレベルに上昇することが可能です」とCWは述べています。
The move would mark a 38% gain from the current trading range.
この動きは、現在の取引範囲から38%の利益をマークします。
At the moment, Dogecoin trades at $0.223. It has risen 2.96% over the past 24 hours and now stands above its 200 EMA, currently set near $0.216. That moving average serves as a critical support level and gives bulls confidence in holding their positions.
現時点では、Dogecoinは0.223ドルで取引されています。過去24時間で2.96%上昇し、現在は200 EMAを超えており、現在は0.216ドル近くに設定されています。その移動平均は重要なサポートレベルとして機能し、ブルズが自分の立場を保持することに自信を与えます。
A clear push above $0.228 is seen as a confirmation level. If that happens, DOGE may then aim for the next resistance zone around $0.265, with $0.3 becoming a strong psychological and technical target after that.
0.228ドルを超える明確なプッシュは、確認レベルと見なされます。その場合、Dogeは次の抵抗ゾーンを約0.265ドルに目指し、その後0.3ドルが強力な心理的および技術的ターゲットになります。
Volume has remained steady, and recent candles on the chart reflect growing buyer interest. If that buying pressure continues and is paired with a surge in volume, the price could break higher faster than expected. No signs of weakness have appeared yet.
ボリュームは安定しており、チャートの最近のろうそくは買い手の関心の高まりを反映しています。その購入圧力が続いており、ボリュームの急増とペアになっている場合、価格は予想よりも速く上昇する可能性があります。衰弱の兆候はまだ現れていません。
Supporting the positive outlook, the Relative Strength Index (RSI) now reads 60.21. That places Dogecoin firmly in bullish territory but not at the point of being overbought. A reading above 50 suggests strength, and being under 70 shows that there’s still room for more gains. There’s no indication yet of a reversal on the horizon.
正の見通しをサポートすると、相対強度指数(RSI)は60.21を読み取ります。それはドッグコインを強気の領土にしっかりと置いていますが、買い過ぎの時点ではありません。 50を超える読み取りは強みを示唆しており、70歳未満であることは、より多くの利益の余地がまだあることを示しています。地平線上の逆転の兆候はまだありません。
Beyond the charts, on-chain data backs the growing optimism. Over the past month, major Dogecoin holders—commonly referred to as whales—have accumulated over 1 billion DOGE. These large wallets now control around 25.97 billion tokens. This increase in holdings is often seen as a sign of confidence, with accumulation hinting at expectations for a price rise.
チャートを超えて、オンチェーンデータは、成長する楽観主義を裏付けています。過去1か月間、主要なDogecoin所有者は、間違いなくクジラと呼ばれ、10億人以上のDogeを蓄積しています。これらの大きな財布は現在、約259億7000万トークンを制御しています。この保有の増加は、しばしば自信の兆候と見なされ、蓄積は価格上昇への期待を示唆しています。
There are clear levels of support if the price sees a decline. The $0.216 level, which matches the 200 EMA, is the first safety net. If the price slips below that, there is added support at $0.205, matching the 100 EMA. A deeper decline that holds below $0.202 could erase the bullish setup and push the coin into another phase of sideways movement or even losses.
価格が低下した場合、明確なレベルのサポートがあります。 200 EMAと一致する0.216ドルのレベルが最初のセーフティネットです。価格がその下に滑る場合、100 EMAに一致するサポートが0.205ドルに追加されます。 0.202ドルを下回る深い衰退は、強気のセットアップを消去し、コインを横向きの動きや損失の別の段階に押し込む可能性があります。
All signals, however, point upward at the moment. The $0.228 resistance is the line to watch. A confirmed move past that could ignite a rally toward the long-watched $0.3 mark, a level Dogecoin hasn’t reached in months. With momentum building and whales positioning, the coin appears set for a possible breakout.
ただし、すべての信号は現時点で上方に向かっています。 0.228ドルの抵抗は、視聴するラインです。長い視聴された$ 0.3マークに向かって集会を発火させる可能性のある過去の過去の確認。勢いのある建物とクジラの配置により、コインは可能性のあるブレイクアウトのために設定されているように見えます。
免責事項:info@kdj.com
提供される情報は取引に関するアドバイスではありません。 kdj.com は、この記事で提供される情報に基づいて行われた投資に対して一切の責任を負いません。暗号通貨は変動性が高いため、十分な調査を行った上で慎重に投資することを強くお勧めします。
このウェブサイトで使用されているコンテンツが著作権を侵害していると思われる場合は、直ちに当社 (info@kdj.com) までご連絡ください。速やかに削除させていただきます。
-

-

-

- グレートウェルスショーダウン:ゴールドvs.ビットコイン
- 2025-05-19 09:00:13
- 今日の金融市場のきらめく表面の下で、古代のチャンピオンとデジタル候補者が劇的な対決の準備をしています。
-

-

-

-

-

-


