


-
 bitcoin
 $87959.907984 USD
1.34% - ethereum
$2920.497338 USD
3.04% - tether
$0.999775 USD
0.00% - xrp
$2.237324 USD
8.12% - bnb
$860.243768 USD
0.90% - solana
$138.089498 USD
5.43% - usd-coin
$0.999807 USD
0.01% - tron
$0.272801 USD
-1.53% - dogecoin
$0.150904 USD
2.96% - cardano
$0.421635 USD
1.97% - hyperliquid
$32.152445 USD
2.23% - bitcoin-cash
$533.301069 USD
-1.94% - chainlink
$12.953417 USD
2.68% - unus-sed-leo
$9.535951 USD
0.73% - zcash
$521.483386 USD
-2.87%


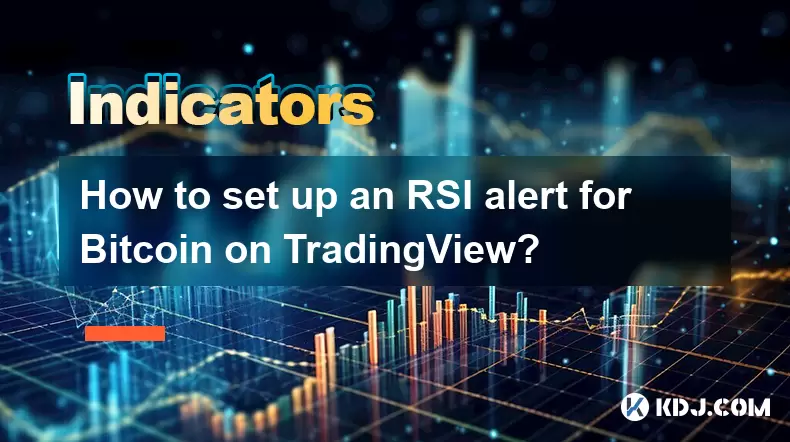
Wie richte ich einen RSI -Alarm für Bitcoin auf TradingView ein?
"Set Bitcoin RSI alerts on TradingView by configuring overbought (70) and oversold (30) levels, customizing notifications via email or webhook for timely trade signals."
Jul 08, 2025 at 11:42 am
Verständnis des RSI -Indikators im Kryptowährungshandel
Der relative Festigkeitsindex (RSI) ist ein Impulsoszillator, der zur Messung der Geschwindigkeit und Änderung der Preisbewegungen verwendet wird. Beim Kryptowährungshandel, insbesondere für Vermögenswerte wie Bitcoin , hilft die RSI Händlern überkaufte oder überverkaufte Bedingungen. Wenn der RSI über 70 steigt, signalisiert sie normalerweise, dass ein Vermögenswert überkauft werden kann, während eine Lesung unter 30 darauf hindeutet, dass dies möglicherweise überverkauft ist. Diese Informationen sind entscheidend, wenn Sie Warnungen auf Plattformen wie TradingView einrichten.
Um RSI für Bitcoin effektiv zu verwenden, ist es wichtig zu verstehen, wie sich der Indikator in hohen Volatilitätsperioden verhält. Da der Preis von Bitcoin innerhalb kurzer Zeit dramatisch schwingen kann, wird die Anpassung der RSI -Einstellungen und die Warnung von Schwellenwerten entsprechend für genaue Handelssignale von entsprechend wichtiger.
Navigieren nach Bitcoin -Argabendern auf TradingView
Vor dem Einrichten einer Warnung müssen Benutzer zunächst das richtige Diagramm für Bitcoin in TradingView suchen. Um dies zu tun:
- Öffnen Sie die TradingView -Website oder -App.
- Verwenden Sie die Suchleiste oben, um nach "BTC" oder "Bitcoin" zu suchen.
- Wählen Sie das entsprechende Marktpaar wie BTC/USD oder BTC/USDT ab, abhängig von Ihren bevorzugten Austauschdaten.
Sobald das Diagramm geladen wird, stellen Sie sicher, dass es den richtigen Zeitrahmen anzeigt, an dem Sie interessiert sind-ob es sich um eine 1-stündige, 4-stündige, tägliche oder andere Intervall handelt. Die Genauigkeit Ihres RSI -Alarms hängt stark von den ausgewählten Diagrammparametern ab.
Hinzufügen des RSI -Indikators zu Ihrem Bitcoin -Andiagramm
Nach dem Laden des korrekten Bitcoin -Andiagramms wird der nächste Schritt die RSI -Anzeige zur Schnittstelle hinzufügen:
- Klicken Sie auf die Schaltfläche „Anzeigen“ oben im Diagramm.
- Geben Sie "RSI" in das Suchfeld ein.
- Wählen Sie den Relativstärkeindex aus der angezeigten Liste aus.
Standardmäßig ist der RSI auf eine 14-Perioden-Konfiguration eingestellt, die für die meisten Szenarien gut funktioniert. Fortgeschrittene Händler können jedoch entscheiden, diesen Wert anhand ihrer Strategie anzupassen. Sobald das RSI -Fenster hinzugefügt wird, wird je nach Layouteinstellungen entweder unter oder in der Preiskarte überlagert.
Konfigurieren von benutzerdefinierten Alarmbedingungen für RSI -Ebenen
Das Einrichten einer Warnung erfordert die Definition spezifischer Triggerpegel für das RSI. Zum Beispiel wollen viele Händler benachrichtigt werden, wenn Bitcoin ein überkauftes Niveau von 70 oder ein überverkauftes Niveau von 30 erreicht:
- Klicken Sie mit der rechten Maustaste auf die RSI-Linie oder öffnen Sie die Anzeigeneinstellungen.
- Suchen Sie nach Optionen im Zusammenhang mit Alarmbedingungen oder Schwellenwerten .
- Aktivieren Sie die Funktion, die Warnungen ermöglicht, wenn das RSI diese Ebenen überschreitet.
Einige Versionen von TradingView ermöglichen benutzerdefinierte Scripting mit Pine Skript , um eine komplexere Warnungslogik zu ermöglichen. Zum Beispiel können Benutzer Warnungen erstellen, die nur dann ausgelöst werden, wenn RSI über 70 kreuzt, nachdem sie für mehrere Kerzen unter sich gelegt haben, wodurch falsch positive Ergebnisse während flüchtiger Schwankungen reduziert werden.
Erstellen und Verwalten von Benachrichtigungen über TradingView
Mit dem konfigurierten RSI ist es Zeit, den tatsächlichen Alarm zu erstellen:
- Klicken Sie auf das Bell -Symbol in der oberen rechten Ecke des Diagramms.
- Wählen Sie "Alarm erstellen".
- Setzen Sie die Bedingung: Zum Beispiel "RSI kreuzt über 70" oder "RSI kreuzt unter 30".
- Wählen Sie Benachrichtigungsmethoden wie E-Mail, SMS oder Webhook, wenn Sie in Apps von Drittanbietern integriert sind.
- Geben Sie der Warnung einen beschreibenden Namen wie "BTC RSI OverAt Alert".
Benutzer können vorhandene Warnungen auch verwalten, indem sie auf das gleiche Bell -Symbol klicken und nach Bedarf bearbeiten oder löschen. Es ist wichtig, Warnungen mit historischen Daten oder geringfügigen Schwellenwertänderungen zu testen, um sicherzustellen, dass sie korrekt funktionieren, bevor sie sich auf sie für lebende Handelsentscheidungen verlassen.
Anpassung von Benachrichtigungen und Integration externer Tools
Für Händler, die Echtzeit-Updates wünschen, ohne das TradingView ständig zu überprüfen, verbessert die Integration externer Tools das Benutzprogramm für das Benachrichtigung:
- Verwenden Sie Webhooks , um TradingView -Warnungen mit Plattformen wie Telegramm -Bots, Discord -Servern oder Handels -APIs zu verbinden.
- Konfigurieren Sie E -Mail -Benachrichtigungen über die Benutzerprofileinstellungen unter der Registerkarte "Warnungen".
- Passen Sie die Alarmfrequenz an, um übermäßige Benachrichtigungen unter abgehackten Marktbedingungen zu vermeiden.
Diese Integrationen ermöglichen es Händlern, zeitnahe Aktualisierungen zu erhalten, auch wenn nicht von der Plattform. Zum Beispiel ermöglicht die Verbindung zu IFTTT (falls dies dann dies) Automatisierungsworkflows, bei denen Warnungen Aktionen wie das Senden von E -Mails oder Protokollierungsdaten an Tabellenkalkulationen auslösen können.
Häufig gestellte Fragen
Kann ich mehrere RSI -Warnungen für verschiedene Zeitrahmen einstellen? Ja, TradingView ermöglicht es Benutzern, für jeden Zeitraum separate Warnungen zu erstellen. Jedes Diagramm-Setup wird unabhängig voneinander behandelt, sodass Sie gleichzeitig Warnungen für 1-Stunden-, 4-Stunden- und tägliche Diagramme haben können.
Was soll ich tun, wenn mein RSI -Alarm nicht auslöst? Überprüfen Sie die Alarmbedingungen und stellen Sie sicher, dass sie mit den aktuellen Diagrammeinstellungen übereinstimmen. Überprüfen Sie außerdem Ihre Benachrichtigungseinstellungen und Ihre Internetkonnektivität. Manchmal treten verzögerte Warnungen aufgrund serverseitiger Probleme oder falschen Kiefernskriptkonfigurationen auf.
Ist es möglich, Warnungen direkt auf meinem mobilen Gerät zu erhalten? Ja, TradingView bietet eine mobile App, die Push -Benachrichtigungen für Warnungen unterstützt. Stellen Sie sicher, dass die Benachrichtigungen sowohl in den App -Einstellungen als auch im Betriebssystem Ihres Geräts aktiviert sind.
Wie lösche oder bearbeite ich eine vorhandene RSI -Warnung? Öffnen Sie die Warnpanel über das Bell -Symbol, suchen Sie die gewünschte Warnung und klicken Sie auf das Symbol Bleistift (Bearbeiten) oder Müll (Löschen) daneben. Sie können eine beliebige Bedingungs- oder Benachrichtigungsmethode im Bearbeitungsmenü ändern.
Haftungsausschluss:info@kdj.com
Die bereitgestellten Informationen stellen keine Handelsberatung dar. kdj.com übernimmt keine Verantwortung für Investitionen, die auf der Grundlage der in diesem Artikel bereitgestellten Informationen getätigt werden. Kryptowährungen sind sehr volatil und es wird dringend empfohlen, nach gründlicher Recherche mit Vorsicht zu investieren!
Wenn Sie glauben, dass der auf dieser Website verwendete Inhalt Ihr Urheberrecht verletzt, kontaktieren Sie uns bitte umgehend (info@kdj.com) und wir werden ihn umgehend löschen.
- RAIN Jetzt handeln
$0.007852
113.00%
- PIPPIN Jetzt handeln
$0.06097
51.96%
- PARTI Jetzt handeln
$0.1396
42.04%
- WAVES Jetzt handeln
$0.9141
41.69%
- ARC Jetzt handeln
$0.04302
35.73%
- HONEY Jetzt handeln
$0.01029
21.80%


- Bitcoin, eCash Fork und Airdrop Dynamics: Ein tiefer Einblick in die neuesten Kontroversen im Kryptobereich
- 2026-05-03 12:55:01
- Konsens 2026 Miami: Web3, Blockchain, Kryptowährung, NFTs, Metaverse, Konferenz, 5. Mai – Wo die Wall Street auf die digitale Grenze trifft
- 2026-05-02 12:45:01
- Die Fed hält die Zinsen stabil, was inmitten geopolitischer Spannungen einen Bitcoin-Preisverfall auslöst
- 2026-05-01 06:45:01
- Bitcoin-Miner elektrifizieren das Netz: Der Erwerb eines Gaskraftwerks in Ohio läutet eine neue Ära für digitales Gold ein
- 2026-05-01 00:45:01
- Der MEGA-Token von MegaETH erreicht den Big Apple: Er setzt neue Leistungsmaßstäbe für Echtzeit-Blockchain
- 2026-05-01 00:55:01
- Solanas rutschiger Abhang: Die Preisprognose deutet auf einen Widerstandsverlust und mögliche weitere Rückgänge hin
- 2026-05-01 06:45:01
Verwandtes Wissen

Wie signalisiert eine RSI-Überdehnung eine mögliche Kryptokorrektur?
Jun 29,2026 at 04:39pm
RSI-Überdehnungsmechanismen in Kryptomärkten 1. RSI-Werte über 70 weisen auf überkaufte Bedingungen hin, in denen der Kaufdruck an großen Börsen wie B...

Was ist die stochastische RSI-Crossover-Strategie im Kryptohandel?
Jun 29,2026 at 02:00pm
Stochastische RSI-Grundlagen in Kryptowährungsmärkten 1. Der stochastische RSI ist vom Standard-RSI abgeleitet, wendet jedoch die stochastische Oszill...

Wie hilft die Verzögerungsspanne der Ichimoku-Wolke bei der Kryptoanalyse?
Jul 03,2026 at 06:59am
Verzögerungsspannenfunktionalität in Krypto-Charts 1. Chikou Span stellt den aktuellen Schlusskurs dar, der um 26 Perioden nach hinten verschoben wurd...

Was verrät der OBV-Spitze über die Aktivität von Kryptowalen?
Jun 30,2026 at 01:19am
Muster des Bilanzvolumens und der Walakkumulation 1. Ein starker OBV-Anstieg geht mit ungewöhnlich großen Zuflüssen in Börsen-Wallets einher, die häuf...

Wie deutet ein ATR-Anstieg auf Panikverkäufe auf den Kryptomärkten hin?
Jun 28,2026 at 03:39pm
ATR Spike als Echtzeit-Paniksignal 1. Die Average True Range (ATR) misst die Volatilität, indem sie den Durchschnitt der wahren Ranges über einen defi...

Wie fungiert SMA als psychologische Ebene auf Kryptomärkten?
Jun 28,2026 at 06:19pm
Psychologische Verankerung in der Marktstimmung 1. Social Media Addiction (SMA) manifestiert sich auf Kryptomärkten durch anhaltende Aufmerksamkeitsfi...
Wie signalisiert eine RSI-Überdehnung eine mögliche Kryptokorrektur?
Jun 29,2026 at 04:39pm
RSI-Überdehnungsmechanismen in Kryptomärkten 1. RSI-Werte über 70 weisen auf überkaufte Bedingungen hin, in denen der Kaufdruck an großen Börsen wie B...
Was ist die stochastische RSI-Crossover-Strategie im Kryptohandel?
Jun 29,2026 at 02:00pm
Stochastische RSI-Grundlagen in Kryptowährungsmärkten 1. Der stochastische RSI ist vom Standard-RSI abgeleitet, wendet jedoch die stochastische Oszill...
Wie hilft die Verzögerungsspanne der Ichimoku-Wolke bei der Kryptoanalyse?
Jul 03,2026 at 06:59am
Verzögerungsspannenfunktionalität in Krypto-Charts 1. Chikou Span stellt den aktuellen Schlusskurs dar, der um 26 Perioden nach hinten verschoben wurd...
Was verrät der OBV-Spitze über die Aktivität von Kryptowalen?
Jun 30,2026 at 01:19am
Muster des Bilanzvolumens und der Walakkumulation 1. Ein starker OBV-Anstieg geht mit ungewöhnlich großen Zuflüssen in Börsen-Wallets einher, die häuf...
Wie deutet ein ATR-Anstieg auf Panikverkäufe auf den Kryptomärkten hin?
Jun 28,2026 at 03:39pm
ATR Spike als Echtzeit-Paniksignal 1. Die Average True Range (ATR) misst die Volatilität, indem sie den Durchschnitt der wahren Ranges über einen defi...
Wie fungiert SMA als psychologische Ebene auf Kryptomärkten?
Jun 28,2026 at 06:19pm
Psychologische Verankerung in der Marktstimmung 1. Social Media Addiction (SMA) manifestiert sich auf Kryptomärkten durch anhaltende Aufmerksamkeitsfi...
Alle Artikel ansehen


