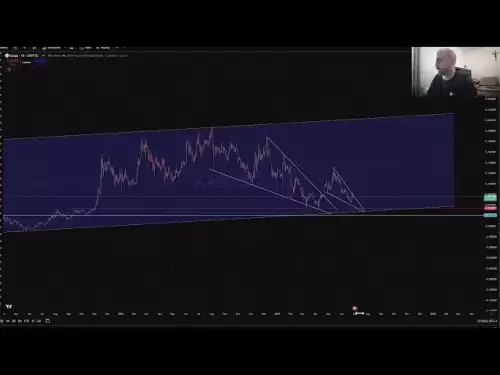
**SUI Token CRITICAL Support Test! Bull Market Support Band Analysis 📊** In this video, I break down the crucial technical situation developing with SUI/USD as it tests a make-or-break level at the Bull Market Support Band. With SUI currently trading at $2.73 after a -5.26% decline from recent highs near $5.00, we're witnessing a pivotal moment that could determine the token's next major move. 🔍 **What You'll Learn:** • Bull Market Support Band indicator breakdown and what it means • Critical support level at $2.76 that could make or break the trend • Descending trendline resistance analysis • Two key scenarios: bullish bounce vs bearish breakdown • Price targets for both bullish and bearish outcomes • Why the next few weekly candles are absolutely crucial 📈 **Key Levels to Watch:** - Support: $2.76 (Lower BMSB) - Resistance: $3.37 (Upper BMSB) & $3.50-$4.00 (Trendline) - Bearish Target: $2.00-$2.20 if support fails This is NOT financial advice - always do your own research and manage risk appropriately. **Timestamps:** 0:00 - Introduction & Current Market State 2:15 - Bull Market Support Band Explained 4:30 - Critical Support Analysis 6:45 - Bullish vs Bearish Scenarios 8:20 - Key Levels & Price Targets 10:00 - Final Thoughts & What to Watch 👍 Like this video if you found the analysis helpful! 🔔 Subscribe for more crypto technical analysis 💬 Let me know your thoughts on SUI in the comments below! #SUI #CryptoAnalysis #TechnicalAnalysis #TradingView #BullMarketSupportBand
The information provided is not trading advice. kdj.com does not assume any responsibility for any investments made based on the information provided in this article. Cryptocurrencies are highly volatile and it is highly recommended that you invest with caution after thorough research!
If you believe that the content used on this website infringes your copyright, please contact us immediately (info@kdj.com) and we will delete it promptly.