


 in Geometry Dash")


 |
|
 |
|
 |
|
 |
|
 |
|
 |
|
 |
|
 |
|
 |
|
 |
|
 |
|
 |
|
 |
|
 |
|
 |
|
Cryptocurrency News Video
6.2 The small rebound channel of Bitcoin is weak. and the probability of breaking the market in the future is high! Support area will be tested!
Jun 02, 2025 at 03:16 am 比特币队长Captain
Assistant's only telegram: bpq2020 (Note that bpq2020Msg is a liar!) Click the link to add Assistant's telegram: https://t.me/bpq2020 Bitcoin's real-time changes, what can be done is to analyze the next trend with a higher probability based on the current structure, and thus make a trading plan with a suitable profit-loss ratio. Generally, there is a top-bottom structure (double bottom, triangle, head and shoulder bottom, arc bottom, V bottom) which is easy for retail investors to identify and are likely to get out of the band. The pursuit of grabbing bands is the core password for continuous and stable outperforming the market. Summary of my 8 years of Bitcoin trading experience: superstitious analysis, blindly following operations, firm belief, high-powered Soha will definitely lose money as soon as possible! I wish all my friends who follow me good luck and always accompany you! [About the analysis timeline] 1H corresponds to a 1-3-day cycle, and the band corresponds to an amplitude of about US$2,000. 4H corresponds to a 7-20-day cycle, and the band corresponds to an amplitude of about US$5,000. The daily line corresponds to a 20-2-month cycle, and the band corresponds to an amplitude of about US$10,000. The weekly line corresponds to a 3-6-month cycle, and the band corresponds to an amplitude of about US$30,000. [About the analysis of common indicators] 1. Cloud diagram (one-picture balance table Ichimoku), default parameters, commonly used first-hand belt A and first-hand belt B. Use this indicator to determine the corresponding level of the top and bottom structure and the trend direction. This indicator is the main reference. In addition to searching for free indicator explanations on Youtube, we also have advanced paid course learning guidance. 2. MACD, the default parameter, is often used to judge deviation and assist in reference. 3. Trading volume is often used to judge the strength at the end of the trend and assist in reference. All the comments in this video and this article do not constitute any investment advice! For learning and communication only. #Bitcoin#Bitcoin Quotation#BTC#BTC#Crime Techniques#Crime Speculation Strategy#Crime Speculation Experience#Bitcoin Quotation#Captain Bitcoin#CaptainBTC#Bitcoin Mining#Bitcoin Captain#Bitcoin Captain
Disclaimer:info@kdj.com
The information provided is not trading advice. kdj.com does not assume any responsibility for any investments made based on the information provided in this article. Cryptocurrencies are highly volatile and it is highly recommended that you invest with caution after thorough research!
If you believe that the content used on this website infringes your copyright, please contact us immediately (info@kdj.com) and we will delete it promptly.
-
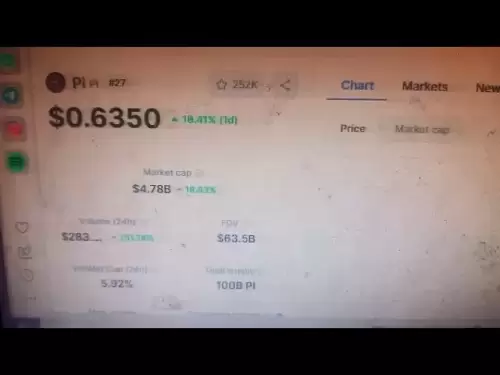
- Pi coin 🪙 listed on binance
- Jun 26, 2025 at 02:15 am Best Qawali nd all
-

-
- Bitcoin Market Analysis Bitcoin Support Level 104500-103500|Key Pressure 107000|ETFs Continuously Fill in Bull Flag Pattern|Can altcoins fly? |As the fastest rate cut in July this year? |The Middle East War Ceasefire? |BTC ETH DOGE ADA BNB
- Jun 26, 2025 at 02:10 am 比特币--大漠
- Telegram free group: t.me/zyjyyDAMO666 Telegram Telegram private chat: t.me/BTC_Damo51888 Email contact: momo199218@outlook.com Hotcoin exchange registration and download: (rebate 20%) https://114.111.61.13/register?hotcoinid=3&icCode=Ah6022fb9 Bitget exchange registration and download: (rebate 20%...
-
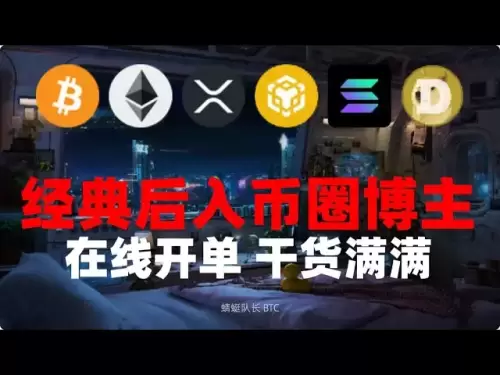
- Classics and later enter the currency circle blogger丨Online orders are full of fresh information
- Jun 26, 2025 at 02:10 am 蜻蜓队长丨BTC crypto
- Thanks for your attention and likes, and update the KOL evaluation video TG contact: https://t.me/Deer_0513 TG group: https://t.me/BTC_133333 There is free kol in the group. Strategies sharing. Extremely high rebate. Register private message. Gate: https://www.gateweb.work/share/VVYWAFlc bitget: https://partner.itouyu.top/bg/U45R9Z...
-

- JASMY Prediction 25/JUN JASMY Coin Price News Today Crypto Technical Analysis Update Price Now
- Jun 26, 2025 at 02:05 am Crypto Infos
- THE BEST EXCHANGE FOR TRADING : https://bit.ly/100Bitget NEW TELEGRAM : https://t.me/Officialcryptoinfos Price News Today - Technical Analysis Update and Price Now! In this video I talk about a...
-
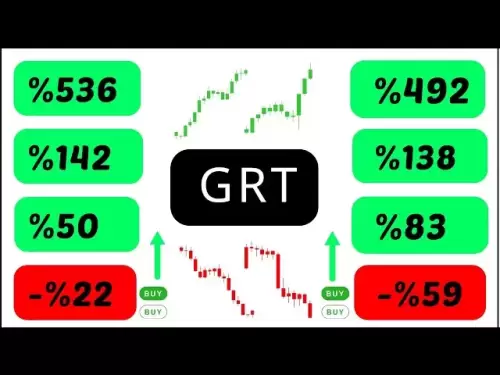
- GT COIN support and resistance analysis, are you ready for critical levels? #Grt #grtcoin #grTanaliz #altcoin
- Jun 26, 2025 at 02:05 am Kripto Storys
- ✍️ Description: 📉 GRT COIN technical levels in this video! The Graph (GRT) is of great importance for data inquiry and web3 projects. In this video, only GRT Coin's current support and resistance levels are simple ...
-

- “Sonic Outruns Eggman! 💥 First Place Duo Win in Green Hill Zone!”
- Jun 26, 2025 at 02:00 am nervous na0fumi
- ⚡ Sonic is built for speed—but this build proves he’s built to win. In this chaotic match from Squad Busters, I paired the new hero Sonic with Coin Stash for early gold scaling and Power Tank to...
-

- Pi Coin Vs Sidra Coin | Which List Binance First | Pi Coin | Pi Network Update | Albarizoncrypto
- Jun 26, 2025 at 02:00 am albarizon Crypto
- Subscribe our Channels: Albarizon: https://www.youtube.com/@albarizon Albarizone: https://www.youtube.com/@albarizone Albarizon Crypto: https://www.youtube.com/@albarizonCrypto Albarizon Tech: https:...
-

- RIPPLE XRP - WALL STREET'S EYES ON YOUR XRP! (BLACKROCK PREDICTS A $10,000 VALUATION!)
- Jun 26, 2025 at 01:55 am Crypto Bacha
- Financial Disclaimer: I am not a licensed financial advisor. The opinions shared in this video are my personal views and are intended solely for entertainment purposes. You (and only you) are...