|
|
 |
|
 |
|
 |
|
 |
|
 |
|
 |
|
 |
|
 |
|
 |
|
 |
|
 |
|
 |
|
 |
|
 |
|
Cryptocurrency News Video
8.25 Bitcoin and Ethereum fell to a low point in the early morning. Will the weekly divergence of the dead cross fall sharply? How to operate
Aug 25, 2025 at 01:48 am 比特币队长Captain
Assistant's only telegram: bpq2020 (Note that bpq2020Msg is a liar!) Click the link to add Assistant's telegram: https://t.me/bpq2020 Bitcoin's real-time changes, what can be done is to analyze the next trend with a higher probability based on the current structure, and thus make a trading plan with a suitable profit-loss ratio. Generally, there is a top-bottom structure (double bottom, triangle, head and shoulder bottom, arc bottom, V bottom) which is easy for retail investors to identify and are likely to get out of the band. The pursuit of grabbing bands is the core password for continuous and stable outperforming the market. Summary of my 8 years of Bitcoin trading experience: superstitious analysis, blindly following operations, firm belief, high-powered Soha will definitely lose money as soon as possible! I wish all my friends who follow me good luck and always accompany you! [About the analysis timeline] 1H corresponds to a 1-3-day cycle, and the band corresponds to an amplitude of about US$2,000. 4H corresponds to a 7-20-day cycle, and the band corresponds to an amplitude of about US$5,000. The daily line corresponds to a 20-2-month cycle, and the band corresponds to an amplitude of about US$10,000. The weekly line corresponds to a 3-6-month cycle, and the band corresponds to an amplitude of about US$30,000. [About the analysis of common indicators] 1. Cloud diagram (one-picture balance table Ichimoku), default parameters, commonly used first-hand belt A and first-hand belt B. Use this indicator to determine the corresponding level of the top and bottom structure and the trend direction. This indicator is the main reference. In addition to searching for free indicator explanations on Youtube, we also have advanced paid course learning guidance. 2. MACD, the default parameter, is often used to judge deviation and assist in reference. 3. Trading volume is often used to judge the strength at the end of the trend and assist in reference. All the comments in this video and this article do not constitute any investment advice! For learning and communication only. #Bitcoin#Ethereum#Ethereum Market Analysis#Bitcoin Market Analysis#Bitcoin Market Analysis#BTC #ETH #BTC Market#Bitcoin Market#CaptainBTC #Bitcoin Mining#Bitcoin Captain#Bitcoin Captain
Disclaimer:info@kdj.com
The information provided is not trading advice. kdj.com does not assume any responsibility for any investments made based on the information provided in this article. Cryptocurrencies are highly volatile and it is highly recommended that you invest with caution after thorough research!
If you believe that the content used on this website infringes your copyright, please contact us immediately (info@kdj.com) and we will delete it promptly.
-

- Funds are shifting from Bitcoin to Ethereum! Wall Street institutions’ ETH reserves exceed 10 million | Will ETH surpass BTC soon?
- Aug 25, 2025 at 01:48 am AI说区块链
- Funds are shifting from Bitcoin to Ethereum! Wall Street institutions ETH reserves exceeded 10 million. A capital rotation from Bitcoin ETF to Ethereu...
-

- Bitcoin "falls out of favor" Ethereum "turns over"; Solana's three meme brothers "cheat"; retail investors are "invisible"? Musk's "grabbing the brand" failed? France fights Durov 20250825
- Aug 25, 2025 at 01:48 am BTV_Michael_币链何在
- Official website: https://bitcointvsg.com/ 【Bitcoin TV】Asian traffic matrix Vietnamese → https://www.youtube.com/@BTV_Vietnam Japanese → https://www.y...
-
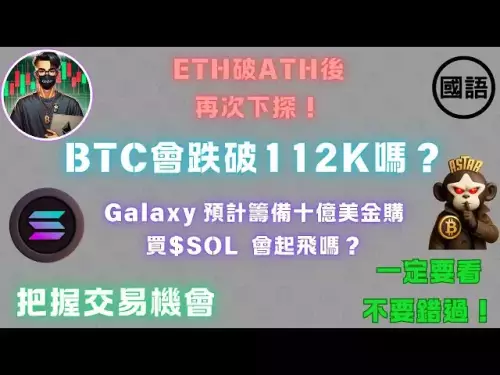
- $ETH breaks ATH (Mandarin), $BTC returns to $112,000 again, can it fall below this time? Galaxy is expected to prepare $1 billion to purchase $SOL? Cryptocurrency Quotes Analysis
- Aug 25, 2025 at 01:48 am Astar.Invest
- Telegram broadcast group: https://t.me/astarinvest Discord community: https://discord.gg/dt4WR8EXBC Instagram: https://www.instagram.com/astar.invest/...
-

-

-

- [Mo Bai] Bitcoin Market View (August 25, 2025): The callback has not ended yet, where can I try to buy at the bottom? ? Related BTC/ETH/SOL/DOGE/PEPE/Bitcoin/Ethereum/Fed rate cut/Powell/Trump
- Aug 25, 2025 at 01:48 am 做交易的墨白
- Mo Bai's public channel: https://t.me/MoBaiSir01 Mo Bai's telegram private chat: https://t.me/mobaisir Mo Bai's WeChat ID code: MoBai14416...
-
- alarm! Is Bitcoin’s plunge and second bottoming out a trap or an opportunity? Where will Ethereum look for next steps after it surges? Seize the opportunity and have a chance to get on the bus! Bitcoin Market Analysis on the Evening of August 25th #Bitcoin Soaring#Bitcoin Soaring
- Aug 25, 2025 at 01:48 am 比特币楠哥
- 2025 8.25#Bitcoin#Bitcoin#Ether 💹Telegram Public Channel: https://t.me/BTCnangeTG 💹Telegram Telegram Private Chat: https://t.me/BTCnange #Bitcoin#Bitc...
-

- 8.25 Bitcoin Ethereum Market Analysis | Is Bitcoin still falling? Is Ethereum going to rise? Nvidia's financial report on Wednesday determines the trend of US stocks|#crypto #btc #eth #dogecoin #bitcoin #bitcoin #bitcoin market #bitcoin market analysis
- Aug 25, 2025 at 01:48 am 比特币阳哥
- [Yang Ge’s only telegram private account] https://t.me/YANGGEBTC [Yang Ge’s only free public channel] https://t.me/btcyangge Except for this telegram ...
-