 |
|
 |
|
 |
|
 |
|
 |
|
 |
|
 |
|
 |
|
 |
|
 |
|
 |
|
 |
|
 |
|
 |
|
 |
|
Cryptocurrency News Articles
Although XRP Has Been Looking Positive, Current Trends and Analysis Show That a Price Decline Could Soon Happen
May 27, 2025 at 01:30 am
Although XRP has been looking positive, current trends and analysis show that a price decline could soon happen. Egrag has shared their thoughts on the main support points for token.

Despite showing promise, XRP appears to be setting the stage for a price decline, according to current trends and analysis by Egrag. The main support levels for the token are also being highlighted.
As the 5-day chart shows, the 21-day Simple Moving Average (SMA) has been a key factor in stabilizing the price over the last five days. This SMA, displayed in blue, has helped to prevent any significant drops in the market.
Moreover, the 33-day SMA on the 3-day timeframe, visualized in red, continues to provide support, indicating a bullish trend for XRP. These moving averages are crucial for maintaining a positive trend in cryptocurrencies.
Furthermore, new data from Glassnode reveals that around 70% of XRP’s total value is derived from holdings accumulated between late 2024 and early 2025. This indicates a massive influx of token holders who began buying after January 2025, when the token reached its highest price of about $3.40.
An increase in short-term holders in the market is usually followed by market price swings. With these newer investors, sensitivity to changes in prices can sometimes induce rapid sell-offs when markets decline. In the past, similar situations in the market have resulted in significant drops in prices.
For instance, in the periods between 2017 and 2021, capital on bitcoin rose due to short-term holders and later dropped by nearly 95% and 80%, respectively.
An increase in short-term XRP holders could lead to a scenario similar to bitcoin’s bear market in 2017.
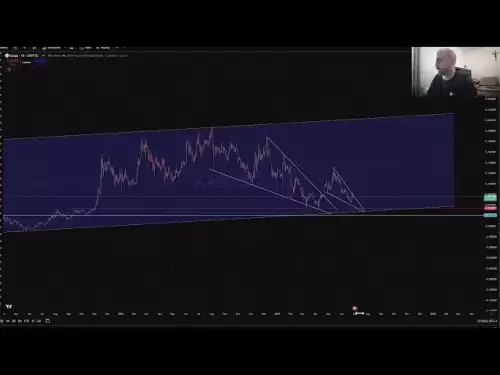
The token price has also been trading within a falling wedge on the weekly chart, potentially setting the stage for a period of price declines. As of May 26, the cryptocurrency struggled to break above the upper trendline of the wedge.
The lack of new highs suggests that this could begin a brief period of decreases and may push the price towards the support line, which is closely aligned with the 50-week Exponential Moving Average (EMA) at $1.76.
If this occurs, the price could decrease by 25%. With these levels in mind, traders and investors should be wary of a possibility of a large correction in the upcoming days.
Although XRP is holding at key technical supports, new short-term investors and past market trends may bring volatility in the price. Individual traders and professionals should pay attention to any upcoming market trends and prepare for any coming corrections.
Disclaimer:info@kdj.com
The information provided is not trading advice. kdj.com does not assume any responsibility for any investments made based on the information provided in this article. Cryptocurrencies are highly volatile and it is highly recommended that you invest with caution after thorough research!
If you believe that the content used on this website infringes your copyright, please contact us immediately (info@kdj.com) and we will delete it promptly.


