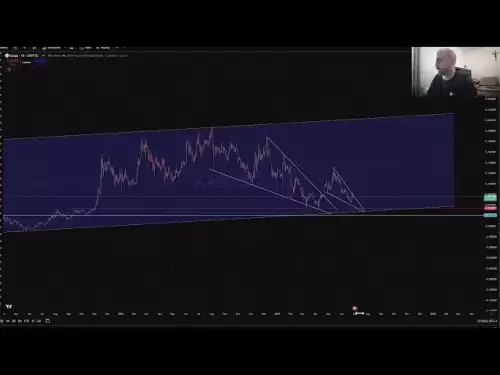
Sui (SUI) shows signs of bullish patterns, hinting at a potential rally towards $27. Technical analysis reveals inverse head and shoulder pattern with a bull pennant, suggesting a possible surge.

Sui (SUI) Primed for a Potential 10x Rally to $27? Bullish Patterns Emerge!
Amidst crypto market uncertainty, Sui (SUI) is showing signs of a major price rally. Technical analysis points to bullish patterns, suggesting a potential surge towards $27.
Technical Combo Sets Stage for SUI Surge
Despite a recent price correction, prominent market expert PlanD highlights the formation of bullish patterns on the SUI daily chart. These patterns, including a bull pennant and an inverse head and shoulder (H&S), suggest an incoming explosive price gain.
Inverse Head and Shoulder Pattern
The inverse H&S pattern is a classic bullish reversal signal. SUI formed the left shoulder at $2.42, the head at $1.74, and is potentially forming the right shoulder around $2.62. According to PlanD's analysis, breaking past the neckline at $4.25 could confirm the bullish reversal, with a price target set at $10.74.
Bull Pennant Formation
The bull pennant, characterized by a strong price uptrend followed by a descending channel, is another bullish indicator. PlanD notes that previous bull pennants on the SUI chart have led to explosive rallies. The current bull pennant, stemming from SUI's surge to its all-time high in January, suggests a long-term price target of $27 – a potential 10x gain from current levels.
SUI Price Overview
Currently, SUI is trading around $2.69. While it has faced struggles in the past month, it still boasts a significant price gain over the last year. The confluence of these bullish technical indicators suggests a potentially bright future for SUI.
Personal Take
While technical analysis isn't a crystal ball, the convergence of these bullish patterns on the SUI chart is compelling. The $27 target seems ambitious, but the potential for significant gains is definitely there. Of course, the crypto market is known for its volatility, so invest wisely, folks!
So, buckle up, crypto enthusiasts! Could SUI be the next big thing? Only time will tell, but the charts are certainly looking interesting. Let's see if SUI can really go from where it is now to $27! I'm grabbing my popcorn!
Disclaimer:info@kdj.com
The information provided is not trading advice. kdj.com does not assume any responsibility for any investments made based on the information provided in this article. Cryptocurrencies are highly volatile and it is highly recommended that you invest with caution after thorough research!
If you believe that the content used on this website infringes your copyright, please contact us immediately (info@kdj.com) and we will delete it promptly.


