 |
|
 |
|
 |
|
 |
|
 |
|
 |
|
 |
|
 |
|
 |
|
 |
|
 |
|
 |
|
 |
|
 |
|
 |
|
Cryptocurrency News Articles
Stellar's Struggle: Resistance Persists, Rally Rejects Abound
Nov 07, 2025 at 01:50 am
Stellar (XLM) faces ongoing resistance, with rally attempts repeatedly rejected. A look at the key levels, volume analysis, and potential future movements.

Stellar's Struggle: Resistance Persists, Rally Rejects Abound
Stellar (XLM) is having a tough time. Despite attempts to rally, resistance levels keep pushing it back down. Let's dive into what's happening with XLM and what to watch out for.
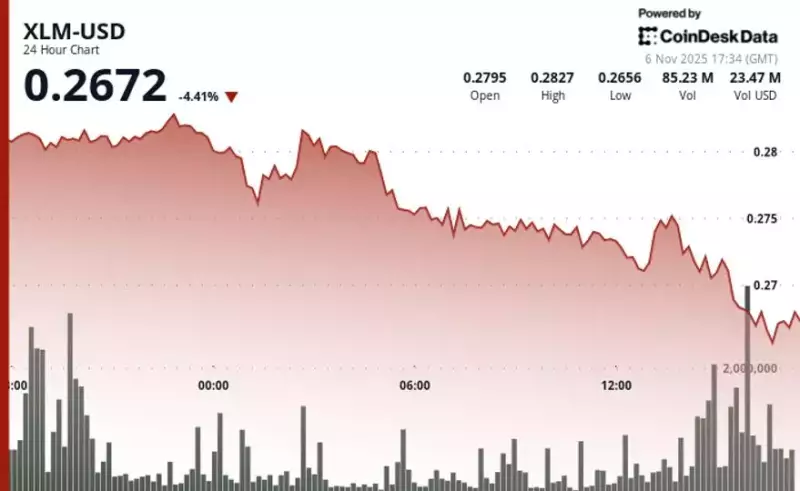
Key Resistance at $0.2815
Recently, Stellar experienced a slide, with a key resistance point at $0.2815. Each attempt to break through this level has been met with strong selling pressure, capping any upside momentum. Trading volume spikes near this resistance, but it's often followed by a rejection, signaling that sellers are in control.
Failed Breakouts and Bearish Signals
Short-term charts show brief recovery attempts, but these are quickly reversed. One example is a failed breakout between $0.2720 and $0.2755, which led to a sharp drop. These false breakouts confirm the prevailing downtrend, leaving traders cautious.
Volume Tells the Story
Volume analysis is crucial here. A surge in trading volume at resistance zones, coupled with price rejection, indicates institutional selling pressure. As trading momentum fades, overall volume contracts, highlighting a lack of buying interest. Without a significant catalyst or a volume-backed breakout above $0.2815, XLM remains vulnerable.
Support Levels to Watch
The immediate support level to watch is around $0.2709. This level has been tested repeatedly, and a break below it could lead to further downside pressure. Traders are eyeing this level as a critical test for XLM.
A Glimmer of Hope? The Tuesday Rally
Interestingly, there was a session where XLM posted modest gains, outperforming the broader crypto market. Trading volume surged above its seven-day average, suggesting institutional repositioning. XLM tested support near $0.256 before recovering, maintaining an ascending pattern with consistent higher lows. This shows there's still some fight left in the bulls.
Pi Network's Parallel Struggle
In a similar vein, Pi Network (PI) is also facing long-term resistance. After a significant decline from its all-time high, PI has struggled to break through a resistance trend line that has been in place for over 250 days. Although there have been brief recoveries, the trend remains uncertain until PI can decisively break through this resistance.
The Bottom Line
Stellar (XLM) is currently in a tug-of-war between buyers and sellers. The key is to watch the $0.2815 resistance and the $0.2709 support. A sustained break above resistance could signal a bullish reversal, while a break below support could lead to further declines. As for Pi, keep an eye on that long-term resistance trend line.
So, is XLM going to break free and soar? Or will it continue to be rejected? Only time will tell. But one thing's for sure: the crypto market never has a dull moment!
Disclaimer:info@kdj.com
The information provided is not trading advice. kdj.com does not assume any responsibility for any investments made based on the information provided in this article. Cryptocurrencies are highly volatile and it is highly recommended that you invest with caution after thorough research!
If you believe that the content used on this website infringes your copyright, please contact us immediately (info@kdj.com) and we will delete it promptly.


![The Graph Price Prediction [GRT Crypto Price News Today] The Graph Price Prediction [GRT Crypto Price News Today]](/uploads/2025/11/07/cryptocurrencies-news/videos/690d4df44fe69_image_500_375.webp)


