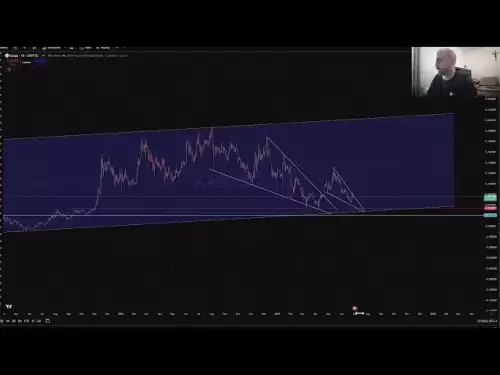
Analyzing Hedera's (HBAR) price movements, technical indicators, and potential for future growth. Is HBAR poised for a breakout, or will it face renewed selling pressure?

Hedera Price: Decoding Technical Signals and Upside Potential
Hedera (HBAR) has been navigating a complex market landscape, with recent price fluctuations sparking interest among traders. Is a significant uptrend on the horizon, or is HBAR destined for further consolidation? Let's dive into the technical signals and potential upside.
Recent Price Action and Key Levels
Recent data shows HBAR trading within a critical range, supported around $0.150 and facing resistance near $0.155. After a sharp decline in mid-June, HBAR experienced a bullish reversal, climbing from approximately $0.125 to $0.155. The current consolidation phase suggests market indecision, with buyers defending support but struggling to overcome resistance.
Technical Indicators: A Mixed Bag
Technical indicators present a mixed picture. The MACD indicator shows a mild bullish crossover, although both the MACD and signal lines remain in negative territory. The Chaikin Money Flow (CMF) indicates that selling pressure still slightly outweighs buying pressure. However, the Relative Strength Index (RSI) has crossed above its moving average, signaling weakening downside momentum.
Open Interest and Market Sentiment
Open interest (OI) in HBAR futures decreased during the mid-June downtrend, reflecting risk aversion. However, the subsequent price rebound saw a modest increase in OI, suggesting cautious re-engagement from market participants. This indicates that the recent recovery has some support, but traders remain hesitant to commit aggressively.
Hedera's Fundamentals: A Strong Foundation
Hedera boasts robust fundamentals, particularly its Hedera Consensus Service (HCS) which enables secure and verifiable ordering of events across decentralized applications. Its unique council model, featuring major corporations like Google and IBM, offers enterprise-grade reliability. Brave New Coin emphasizes this technical foundation, suggesting it supports potential long-term growth.
Upside Potential and Key Considerations
While technical signals are mixed, Hedera's steady volume, enterprise-grade fundamentals, and recent accumulation patterns suggest upside potential. A break above the $0.155 resistance level could signal a more significant uptrend. However, traders should monitor volume and market participation for confirmation.
Final Thoughts
Hedera's price action is definitely one to watch! Will it break through resistance and soar, or will it retreat to lower levels? Only time will tell. Keep an eye on those technicals, and maybe, just maybe, we'll all be sipping margaritas on our HBAR gains soon. Cheers!
Disclaimer:info@kdj.com
The information provided is not trading advice. kdj.com does not assume any responsibility for any investments made based on the information provided in this article. Cryptocurrencies are highly volatile and it is highly recommended that you invest with caution after thorough research!
If you believe that the content used on this website infringes your copyright, please contact us immediately (info@kdj.com) and we will delete it promptly.


