This causes the altcoins to rise above their respective consolidated zones and rise above their resistance.

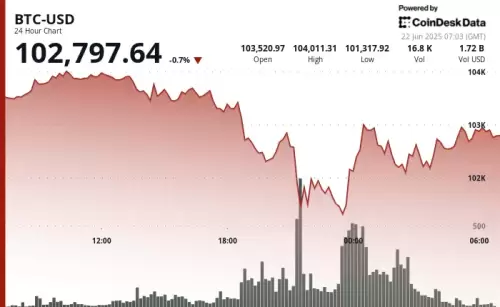
The crypto markets have seen heightened activity as volatility increases, impacting the majority of altcoins. Bitcoin price displayed strength in the past few days, bringing closer the possibility of forming a new ATH before the month ends. This pushed the altcoins to rise above their respective consolidated zones and move towards their next resistance.
However, it has been quite evident that BTC prices do correct and hence the altcoins as well. This could be considered an opportunity, as this consolidation could end soon. The Bitcoin dominance chart has broken down a key support line, which has been acting as support for over 5 months. This signals a money rotation starting to flow from Bitcoin into Altcoins, potentially getting the dominance down to the psychological 60% level. The last time this happened was in November/December 2024, when the altcoins experienced a strong push. On the other hand, the altcoin market capitalization is testing significant resistance, and as the BTC dominance is weak, a good bounce could be on the horizon.
The above chart shows the market capitalization excluding Bitcoin & Ethereum, which are trading within a bull flag. The levels have reached the edge of the consolidation, and a breakthrough could lead it to the previous top, close to $1.13 trillion. This could be when the real Altseason season may begin after breaking above the previous top. Considering the current chart patterns, the next top for the altcoin market capitalization could be somewhere around $1.9 trillion.
On the other hand, the altcoin market capitalization chart is displaying a similar pattern to that it traded during the 2021 bull run. The capitalization broke above the neckline of the head and shoulder pattern and faced some bearish consolidation. However, the levels took off smoothly from there and marked the top. Currently, the levels appear to be at the foot of a massive explosion, and hence, the top for the current cycle could be larger than anticipated.
Disclaimer:info@kdj.com
The information provided is not trading advice. kdj.com does not assume any responsibility for any investments made based on the information provided in this article. Cryptocurrencies are highly volatile and it is highly recommended that you invest with caution after thorough research!
If you believe that the content used on this website infringes your copyright, please contact us immediately (info@kdj.com) and we will delete it promptly.


