





![[Multi SUB] (Full Episode) A beautiful internet celebrity never expected that the guy who was looked down upon as a good-for-nothing would turn out to be a billionaire? ! #counterattack#MiniDrama #Wonderful mainland short drama](/uploads/2026/10/12/cryptocurrencies-news/videos/origin_6acc77b37bebb_image_500_375.webp "[Multi SUB] (Full Episode) A beautiful internet celebrity never expected that the guy who was looked down upon as a good-for-nothing would turn out to be a billionaire? ! #counterattack#MiniDrama #Wonderful mainland short drama")






 |
|
 |
|
 |
|
 |
|
 |
|
 |
|
 |
|
 |
|
 |
|
 |
|
 |
|
 |
|
 |
|
 |
|
 |
|
Cryptocurrency News Articles
Bonk Price Plummets 50% as RSI Drops below Moving Average
Apr 10, 2024 at 03:00 am
- The Bonk crypto price has recently slipped below the 20-day EMA.
- The Bonk price has dropped by 50% in the last month.
The Bonk price has witnessed intense buying pressure since February and recorded an all-time high of $0.0000480 on March 04, 2024. Since February, the Bonk crypto price extended to the $0.0000450 hurdle and gained 355% but failed to sustain. The price was pumped by 115% in just 4 days at the beginning of March.
The BONK price chart has displayed profit booking for the last few weeks. It has been declining by facing resistance from the trendline. Bonk crypto price has slipped by approximately 50% in a month, indicating selling pressure. Recently, the price has faced resistance from the trendline and dropped by 22% in 4 days.
Turning to the technical indicator, the Bonk price has slipped below the 20-day exponential moving average, which showcases a bearish trend. RSI is at 45, which has fallen below the RSI-based moving average, indicating the sellers’ dominance.
Bonk Crypto Price vs Volume Analysis
The graph of price and volume displays that the trading volume has decreased from $2 billion to $120 million, which has affected the price negatively. The trading volume has declined by approximately 65% in a week, and the price has decreased by 20%. The massive change in trading volume may affect the price.
Bonk Crypto Social Dominance and Social Volume Analysis
According to the graph of social media and volume, the gossip and awareness about Bonk crypto has decreased for the last few weeks, and the price has also decreased. Suppose the social dominance and volume increase; buying momentum can be seen for the next few days.
Bonk Price Has Formed a Descending Triangle on a 1-D Timeframe
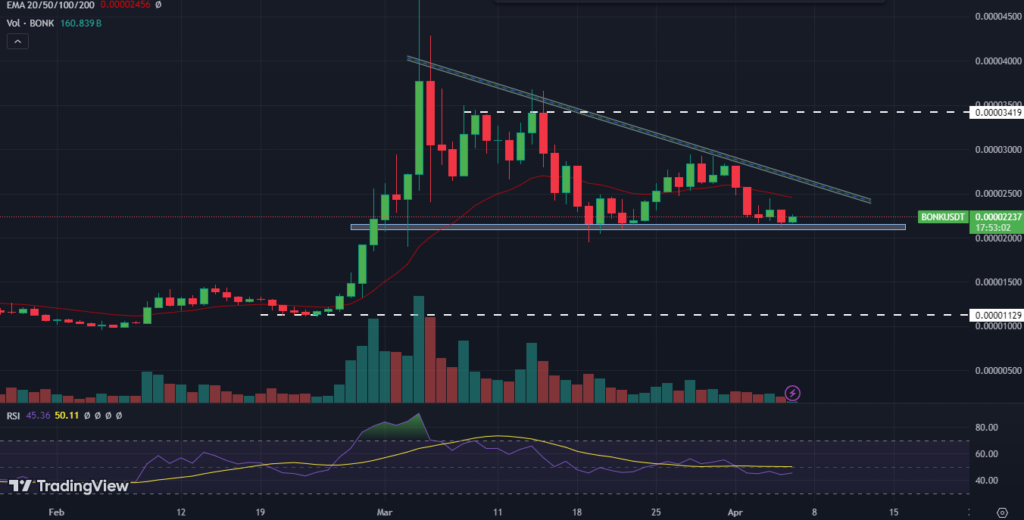
In the daily time frame, the Bonk coin chart has formed a descending triangle pattern and taken support on the $0.0000200 level. Suppose it starts trading below the support level and sustains, selling can be expected. A new all-time high can be seen if the Bonk price fails to defend the $0.0000110 level.
On the other hand, if the Bonk price triggers a breakout from the ascending triangle, it may soon approach the $0.0000300 mark. If the price surpasses the $0.0000300 level, buyers may lift the price to an all-time high. If the Bonk price chart structure manages to attract investors, it may follow the uptrend in the long term.
Bonk Coin Price Prediction on 4-H Timeframe

Bonk coin price has been trading at $0.0000225, which has increased by 3.36% in the last 24 hours. The market capitalization is $1.47 billion, and the fully diluted market cap is $2.11 billion. The circulating supply is 65.19T BONK, and the total supply is 93.53T BONK. The 24-hour trading volume is 119.37 million, which has dropped by 18%.
In a 4-H time frame, the BONK coin price has been facing resistance from the trendline. If the price surpasses the 20-day exponential moving average, it may extend to the trendline. Suppose the price starts trading over the trendline; buying momentum for the next few weeks can be expected.
Alternatively, if the sellers remain strong, the Bonk price may keep declining by facing resistance from the trendline. If the buyers fail to bounce back, the price may melt to a new all-time high.
Conclusion
The Bonk price chart suggests that the price has been on a bullish trend and recently recorded a new all-time high. For the last few weeks, the BONK price has been declining by facing resistance from the trendline. Bonk coin price has slipped below the 20-day exponential moving average and fell by 20% in a week.
Technical Levels
Resistance: $0.0000290 & $0.0000340
Sustain: $0.0000200 & $0.0000110
This article is for informational purposes only and provides no financial, investment, or other advice. The author or any people mentioned in this article are not responsible for any financial loss that may occur from investing in or trading. Please do your research before making any financial decisions.
Disclaimer:info@kdj.com
The information provided is not trading advice. kdj.com does not assume any responsibility for any investments made based on the information provided in this article. Cryptocurrencies are highly volatile and it is highly recommended that you invest with caution after thorough research!
If you believe that the content used on this website infringes your copyright, please contact us immediately (info@kdj.com) and we will delete it promptly.
-

-
- Ledger-Breach-Fallout Reaches EU Amidst Trillion-XRP-Exploit Patch & EU-SEO-Keywords for Crypto Security
- Oct 12, 2026 at 07:55 am
- A tampered Ledger device surfaces in Europe, raising concerns beyond Asia. Meanwhile, an XRP Ledger bug that could have created 18 trillion XRP has been patched, and Vitalik Buterin weighs in on AI-accelerated crypto risks, shaping EU-SEO-Keywords for security awareness.
-
- Starknet Explores Bold Leap to Independent Layer 1 with 2027 Quantum-Resistance Target, Stirring Market Buzz
- Oct 12, 2026 at 07:45 am
- Starknet is eyeing a significant architectural shift, considering an independent Layer 1 blockchain with a quantum-resistance goal for 2027, a move that has ignited considerable market attention and STRK token price fluctuations.
-
-
-
-
-
-


