Bitcoin flirts with its peak as the S&P 500 hits a record high. Will BTC follow, or is a pullback coming? Dive into the trends and predictions.
Bitcoin Price Eyes New All-Time High as S&P 500 Soars
Bitcoin is teetering just below its peak, while the S&P 500 is riding high. Let's break down what's happening and what it means for your crypto wallet.
S&P 500 Sets the Stage
The S&P 500 has reached a new all-time high of 6,223.75, fueled by macroeconomic factors. This bullish momentum raises a critical question: Will Bitcoin follow suit?
Bitcoin's Correlation with the S&P 500
The correlation between Bitcoin and the S&P 500 has been increasing. This suggests that a risk-on sentiment, potentially spurred by the possibility of a September rate cut, could drive Bitcoin's next surge. It's like they're dance partners, one leading the other onto the floor.
Key Levels to Watch for Bitcoin
Keep an eye on these levels: The naked Point of Control (nPOC) at $109,650 acts as key resistance. Support levels lie at $104,347 and $103,463. A breakout above $107,858 could confirm a new uptrend, potentially propelling Bitcoin to $112,424.
Bullish Signs and Potential Pitfalls
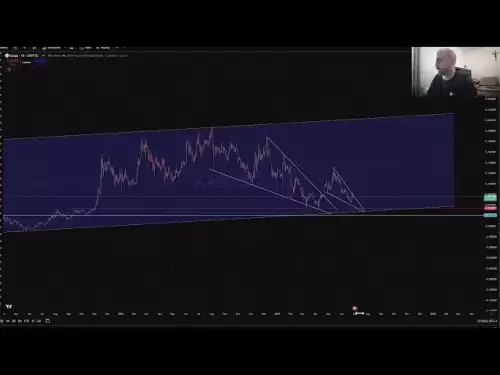
The daily Bitcoin price chart is showing bullish momentum. A decisive break above the upper trend line of the declining parallel channel could signal a significant move upward. However, a breakdown below the $100,000 mark could trigger a correction, potentially sending Bitcoin towards $96,852 or even $93,375.
Final Thoughts: New Highs on the Horizon?
The overall outlook for Bitcoin remains bullish, thanks to calming geopolitical tensions and the potential for a September rate cut. A new all-time high for Bitcoin could be coming soon. But remember, always trade responsibly, and don't bet the farm on crypto!
So, keep your eyes peeled and your wallets ready. The crypto rollercoaster might just be gearing up for another loop-de-loop!
Disclaimer:info@kdj.com
The information provided is not trading advice. kdj.com does not assume any responsibility for any investments made based on the information provided in this article. Cryptocurrencies are highly volatile and it is highly recommended that you invest with caution after thorough research!
If you believe that the content used on this website infringes your copyright, please contact us immediately (info@kdj.com) and we will delete it promptly.


