 |
|
 |
|
 |
|
 |
|
 |
|
 |
|
 |
|
 |
|
 |
|
 |
|
 |
|
 |
|
 |
|
 |
|
 |
|
Cryptocurrency News Articles
Bitcoin Consolidates Below $110,000 as Pepe (PEPE) Price Action Continues to Defy Gravity
May 27, 2025 at 08:01 am
As it consolidates just below the $110,000 mark, Bitcoin's price action continues to defy gravity and hold fast to its recent gains.

As Bitcoin (BTC) consolidates just below the $110,000 mark, the cryptocurrency is displaying resilience in holding onto its recent gains despite a slight lull in the crypto market.
Recently, Bitcoin successfully transformed a key resistance level at $103,000 into support, setting the stage for a bullish trajectory that has propelled the asset upwards. With the next target now set at $115,000, the price structure and technical indicators suggest that the market is gearing up for another leg of the rally.
Crucial Technical Element: Golden Cross
A striking feature of Bitcoin's current configuration is the convergence of moving averages, particularly the impending golden cross—the 50-day EMA is poised to cross above the 200-day EMA. This golden cross is a standard technical element used in technical analysis to identify potential trends in an asset’s price. It occurs when the short-term average price crosses above the long-term average price. The 50-day EMA is used to identify the short-term trend, while the 200-day EMA is used to identify the long-term trend.
When the 50-day EMA crosses above the 200-day EMA, it is known as a golden cross. This cross is often seen as a bullish signal, as it indicates that the short-term trend is turning upwards and that the long-term trend is also turning upwards.
This cross has traditionally been a reliable predictor of bullish cycles. Usually, this type of cross marks the termination of a bearish cycle and the initiation of a more extended rally.
Volume and RSI: Suggest More Upside
Volume data and RSI indicators from TradeStation show that the market is still far from overheated. Even with the remarkable price move, the RSI is still slightly below 70. This suggests that we can expect more upward momentum before the market reaches the usual overbought zone.
Although the $115,000 goal may seem ambitious, Bitcoin has a knack for quickly reaching these targets once momentum builds. Considering the supportive structure and the clear breakout above prior resistance, Bitcoin could even be aiming for a new all-time high in the upcoming months.
Short-term consolidation periods may be experienced by the price, but the technical setup and overall market sentiment strongly favor additional gains. Two important levels to watch out for are the short-term trendline that has been sustaining this upward move and the immediate support at around $103,000.
As the crypto market continues to trade in a limited range, a top-tier trader's massive long positions in Pepe (PEPE) have pushed the cryptocurrency back into the spotlight on the charts.
Known for his bold wagers, the trader, who is ranked no.1 on the FTX (bankrupt) leaderboard, decided to place a massive 7,000,000,000 PEPE position using 10x leverage.
This daring move has started to ripple through the market, propelling the price higher even as other market conditions remain relatively muted.
At the time of writing, PEPE has managed to rally to $0.00001382 during a brief but noticeable upswing. Some top traders like James Wynn already have $130,000 in unrealized profit on this enormous leveraged bet. It is the primary driver of this abrupt uptick even though the larger cryptocurrency market has not shown any notable catalysts for Pepe's spike.
A quick glance at the charts shows that Pepe had been in a phase of consolidation around the $0.00001300 area, with the price action coiling up for a possible breakout.
The RSI, currently at about 60, indicates that there may be more upside momentum to come before the market becomes overbought.
Also, the 50-day EMA is converging with the 100-day EMA, which could add to the bullish technical factor. However, it’s crucial to note that this spike seems to be more a result of one trader’s assertive positioning than any significant adjustments made to the project itself.
The moves accompanying the volume spike also appear to support the short-term effects of this large long wager rather than general bullish sentiment for Pepe on the market.
If this wager pans out in the broader market, we can expect to see more volatility and some rapid swings in the price of Pepe. But for now, this seven billion PEPE long has certainly made a splash and may continue to do so in the days ahead.
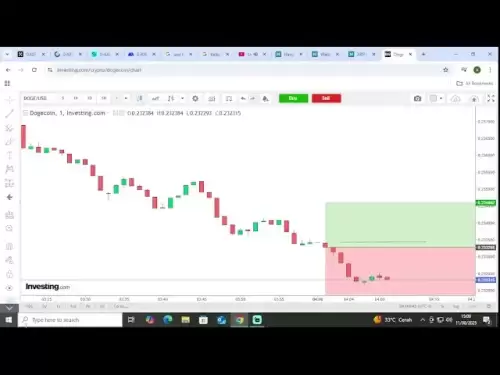
Dogecoin (DOGE) is setting up for an interesting short-term rally as key technical indicators begin to align.
Dogecoin price is currently trading at about $0.217 as it tries to bounce off of lower support.
What Is More Important: Golden Cross Or Volume Spike?
In this case, it
Disclaimer:info@kdj.com
The information provided is not trading advice. kdj.com does not assume any responsibility for any investments made based on the information provided in this article. Cryptocurrencies are highly volatile and it is highly recommended that you invest with caution after thorough research!
If you believe that the content used on this website infringes your copyright, please contact us immediately (info@kdj.com) and we will delete it promptly.


