 |
|
 |
|
 |
|
 |
|
 |
|
 |
|
 |
|
 |
|
 |
|
 |
|
 |
|
 |
|
 |
|
 |
|
 |
|
Hovering around the $92,500 mark, BTC now finds itself at the center of a standoff between bullish momentum and bearish resistance.
![Bitcoin [BTC] Reaches a Critical Juncture Bitcoin [BTC] Reaches a Critical Juncture](/uploads/2025/04/25/cryptocurrencies-news/articles/bitcoin-btc-reaches-critical-juncture/middle_800_480.webp)
Bitcoin (BTC) price is now at a critical juncture, hovering around the $92,500 mark as bullish momentum faces off against bearish resistance.
After a recent pullback from the $94,000 zone, BTC has found support around this level, remaining in a key decision zone.
As the cryptocurrency market eagerly anticipates a move, new data from Alphractal highlights a crucial aspect of this anticipation: short-term holders (STHs) are nearing a key price zone, while leveraged positions have surpassed $10 billion.
STHs and a critical decision
As the red lines in the chart below show, when BTC trades significantly above the STH realized price, it often signals overheated conditions, especially when considering the magnitudes of the movements.
This is highlighted by the red arrows, which usually mark new highs in bull markets and are often followed by corrections. Conversely, the green arrows usually mark points where price either reclaimed or managed to hold above this level, highlighting bullish pivots or periods where STHs managed to accumulate at increasingly difficult price levels.
Currently, BTC is hovering just above the STH realized price, which is also the same level where we can observe a potential build-up of buying pressure, as the STH MVRV is approaching the neutral 1.0 level from below, a zone which is usually associated with either accumulation or impending upside volatility.
At the same time, we can observe that whenever the STH MVRV got close to this zone in the past, it was either a bottom or a major pivot.
BTC STH realized price and MVRV зависят от общей стоимости монет в кошельках, которые не держались в обращении в течение более чем 100 дней, и могут использоваться для оценки того, насколько прибыльными или убыточными в среднем являются STHs в данный момент времени.
A deeper analysis of the on-chain data reveals that the market is bracing for impact.
Both the realized cap impulse and the long-term realized cap impulse indicators are currently in low zones of support, which is something we haven’t seen in a few months.
As the chart below shows, historically, lower readings of these indicators, especially when they occur after periods of dormancy, have coincided with significant price expansions.
Finally, Open Interest tells its own story: leveraged positions remain highly elevated, recently crossing $70 billion. Such buildup usually precedes explosive moves, as either longs or shorts get liquidated all together.
The final stage of the current bull market
According to the latest data from Glassnode, the price of Bitcoin is now at a critical juncture as it hovers around the $92,500 mark.
At this point, bullish momentum is facing off against bearish resistance, and the market is tightly coiled and ready to snap in either direction.
As the chart above shows, after a recent pullback from the $94,000 zone, Bitcoin has found support around this level and remains in a key decision zone.
At the same time, the short-term holders (STHs) are nearing a critical price zone, and leveraged positions have surpassed $10 billion, which is something that usually occurs at market bottoms or major pivots.
STHs are usually defined as entities holding coins for less than 100 days, while the STH realized price is the average price at which STHs acquired their coins, which can be used to assess the STHs’ collective profitability.
When Bitcoin trades significantly above the STH realized price, it often signals overheated conditions, especially if we consider the magnitudes of the movements. This is highlighted by the red arrows in the chart above, which usually mark new highs in bull markets and are often followed by corrections.
Conversely, the green arrows usually mark points where the price either reclaimed or managed to hold above this level, highlighting bullish pivots or periods where STHs managed to accumulate at increasingly difficult price levels.
Currently, Bitcoin is hovering just above the STH realized price, which is also the same level where we can observe a potential build-up of buying pressure, as the STH MVRV is approaching the neutral 1.0 level from below, a zone which is usually associated with either accumulation or impending upside volatility.
At the same time, we can observe that whenever the STH MVRV got close to this zone in the past, it was either a bottom or a major pivot.
The STH realized price and MVRV depend on the total value of coins in wallets that haven’t been used for more than 100 days and can be used to assess how profitable or unprofitable the STHs are on average at a given moment in time.
Disclaimer:info@kdj.com
The information provided is not trading advice. kdj.com does not assume any responsibility for any investments made based on the information provided in this article. Cryptocurrencies are highly volatile and it is highly recommended that you invest with caution after thorough research!
If you believe that the content used on this website infringes your copyright, please contact us immediately (info@kdj.com) and we will delete it promptly.
-

-

-

- The US Federal Reserve Has Withdrawn Crypto Guidance for US Banks, a Move That Could Benefit Ripple's RLUSD Stablecoin and XRP Price
- Apr 25, 2025 at 05:40 pm
- XRP value today trades at $2.19 with a 2.7% decline in 24 hours. This altcoin is experiencing choppy price movements after the recent rally stalled once the altcoin hit the $2.30 barrier.
-

-

-

-

-

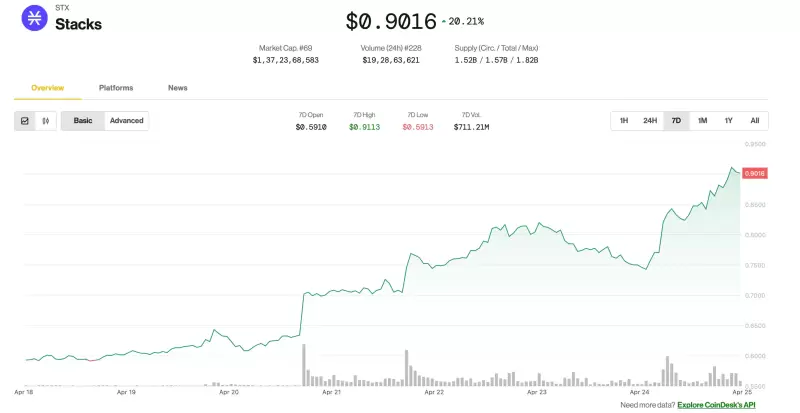
- STX, the native token of Bitcoin layer-2 protocol Stacks, has surged 56% in seven days
- Apr 25, 2025 at 05:30 pm
- STX, the native token of Bitcoin layer-2 protocol Stacks, has surged 56% in seven days to become the week's best-performing of the 100 biggest cryptocurrencies amid hopes for institutional adoption.
-


