 |
|
 |
|
 |
|
 |
|
 |
|
 |
|
 |
|
 |
|
 |
|
 |
|
 |
|
 |
|
 |
|
 |
|
 |
|
Cryptocurrency News Articles
ATOM's Bumpy Ride: Navigating Bollinger Bands and Oversold Signals
Oct 18, 2025 at 04:34 am
ATOM is testing lower Bollinger Band support at $3.16, flashing oversold signals. Is a rebound near, or will it plunge further? Let's dive into the technical tea leaves.

ATOM's Bumpy Ride: Navigating Bollinger Bands and Oversold Signals
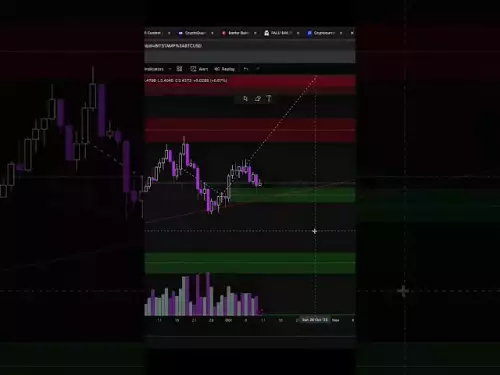
Cosmos (ATOM) has been on a bit of a rollercoaster, huh? Currently trading around $3.16, it's down 3.07% in the last 24 hours. But before you start panic-selling, let's take a closer look at what the technical indicators are telling us. It might not be all doom and gloom, folks!
The Current Situation: Testing the Waters
Right now, ATOM is testing the lower Bollinger Band support. For those not fluent in trader-speak, the Bollinger Bands are like a volatility gauge. When the price gets near the lower band, it could mean the asset is oversold and ripe for a bounce. The Relative Strength Index (RSI) is also approaching oversold territory, adding fuel to that potential fire.
There haven't been any major news events pushing ATOM around lately; it's mostly been technical factors at play. It’s also following Bitcoin's dip, because, well, everything dances to Bitcoin's tune in crypto-land.
Diving Deeper: Technical Analysis Breakdown
Let's get into the nitty-gritty. ATOM is trading below its 20-day and 50-day Simple Moving Averages (SMAs), which isn't a great look. But the Bollinger Band %B indicator is sitting at a low 0.1308, suggesting it's hugging that lower band support at $2.93 pretty closely. Volume is moderate, nothing to write home about, indicating some level of continued interest.
- RSI: At 34.41, it's inching towards oversold. Keep an eye on this.
- MACD: Bearish momentum, but it might be slowing down.
- Stochastic Oscillators: A mixed bag, signaling potential overbought conditions on shorter timeframes.
Key Levels to Watch
- Resistance: $3.53 (the 12-day EMA confluence)
- Support: $2.93 (the lower Bollinger Band boundary)
If ATOM breaks below that $2.93 support, things could get dicey and it might test its 52-week low of $2.95. However, a bounce from these levels needs to reclaim $3.53 to signal any sort of recovery. Think of these levels as your crypto weather forecast.
The Bullish vs. Bearish Scenario
The Bullish Take
A bounce from the lower Bollinger Band, especially if the RSI hits oversold levels, could provide some relief. Any good news in the Cosmos ecosystem or a broader crypto market rebound could help ATOM reclaim the $3.50-$3.80 range. Keep those fingers crossed!
The Bearish Take
If it fails to hold $2.93, we could see a test of the 52-week low at $2.95. A continued crypto market downturn won't help either. Basically, watch out below!
Personal Take
While the technical indicators offer insights, they shouldn't be the only tool in your arsenal. Market sentiment and overall crypto conditions heavily influence ATOM. For example, the broader market's sensitivity to Bitcoin's price swings often amplifies the volatility of altcoins like ATOM, as seen with WIF's recent struggles mirroring Bitcoin's bearish trajectory. I'd say, keep an eye on broader market trends and any fundamental news regarding Cosmos.
Final Thoughts: Keep Your Wits About You
Trading ATOM right now is like navigating a bouncy castle blindfolded. Volatility is high, so manage your risk accordingly. Set those stop-losses (below $2.90 might be wise), and don't bet the farm. Remember, this isn't financial advice – just a friendly heads-up from your neighborhood crypto enthusiast. Happy trading, and may the odds be ever in your favor!
Disclaimer:info@kdj.com
The information provided is not trading advice. kdj.com does not assume any responsibility for any investments made based on the information provided in this article. Cryptocurrencies are highly volatile and it is highly recommended that you invest with caution after thorough research!
If you believe that the content used on this website infringes your copyright, please contact us immediately (info@kdj.com) and we will delete it promptly.


