


-
 bitcoin
 $87959.907984 USD
1.34% - ethereum
$2920.497338 USD
3.04% - tether
$0.999775 USD
0.00% - xrp
$2.237324 USD
8.12% - bnb
$860.243768 USD
0.90% - solana
$138.089498 USD
5.43% - usd-coin
$0.999807 USD
0.01% - tron
$0.272801 USD
-1.53% - dogecoin
$0.150904 USD
2.96% - cardano
$0.421635 USD
1.97% - hyperliquid
$32.152445 USD
2.23% - bitcoin-cash
$533.301069 USD
-1.94% - chainlink
$12.953417 USD
2.68% - unus-sed-leo
$9.535951 USD
0.73% - zcash
$521.483386 USD
-2.87%


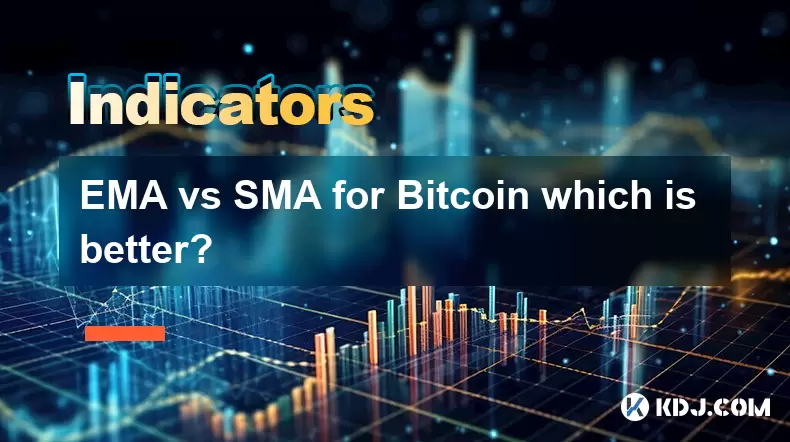
EMA vs SMA for Bitcoin which is better?
Bitcoin traders use EMA for quick trend signals and SMA for smoother, long-term insights, each offering unique advantages in analyzing price movements.
Jul 13, 2025 at 03:14 am
Understanding EMA and SMA in Cryptocurrency Analysis
In the world of cryptocurrency trading, technical indicators play a crucial role in decision-making. Two of the most widely used tools for analyzing Bitcoin's price movements are Exponential Moving Average (EMA) and Simple Moving Average (SMA). Both indicators help traders identify trends, but they do so using different methodologies. The EMA places more weight on recent prices, making it more responsive to new information. On the other hand, the SMA calculates an average of price data over a specified time period with equal weighting for all values.
EMA is particularly favored by short-term traders due to its sensitivity to price changes, while SMA is often preferred by long-term investors who seek smoother trend lines. Understanding how each indicator reacts to market conditions is essential when deciding which one to use for Bitcoin analysis.
How EMA Reacts Faster to Price Changes
One of the main differences between EMA and SMA lies in their responsiveness to recent price fluctuations. Since EMA gives more importance to the latest data points, it tends to react faster to sudden price movements. This characteristic makes it ideal for traders who want to capture momentum shifts quickly. For example, during a sharp rally or crash in Bitcoin’s value, the EMA line will adjust almost immediately, reflecting the new trend before the SMA does.
- EMA uses a multiplier that emphasizes the most recent closing prices
- This results in quicker signals compared to the SMA, which averages all data uniformly
- In volatile markets like Bitcoin, where rapid moves are common, this speed can be advantageous
This responsiveness can help traders enter or exit positions sooner than they would with the slower-moving SMA.
Why SMA Offers Smoother Trend Lines
While EMA excels at detecting early trend reversals, SMA provides a more stable view of price movement over time. Because it treats all historical data equally, SMA filters out some of the noise caused by short-term volatility. This smoothing effect makes it easier to spot long-term trends without being misled by temporary price spikes or dips.
- SMA helps eliminate false signals that may arise from sudden market swings
- It offers clearer support and resistance levels in trending markets
- For Bitcoin investors who hold positions for weeks or months, SMA can provide reliable directional guidance
Therefore, those who prioritize stability and clarity in their charts may find SMA more suitable for tracking Bitcoin’s broader price trajectory.
Using EMA for Short-Term Bitcoin Trading Strategies
Traders focusing on intraday or swing trades often rely on EMA crossovers to generate buy or sell signals. A popular strategy involves using the 9-day and 21-day EMAs. When the shorter EMA crosses above the longer one, it suggests a potential uptrend. Conversely, a crossover below indicates a downtrend.
- Apply both EMA(9) and EMA(21) to your Bitcoin chart
- Monitor the interaction between the two lines closely
- Use additional confirmation tools such as volume or RSI to avoid premature entries
This approach allows traders to act swiftly in fast-moving environments, especially when Bitcoin experiences high volatility.
Leveraging SMA for Long-Term Bitcoin Investment Decisions
For long-term holders or investors, SMA serves as a valuable tool for identifying macro trends. The 50-day and 200-day SMAs are commonly watched indicators. When Bitcoin’s price remains consistently above these moving averages, it signals a bullish phase. A sustained drop below them, however, might indicate a bearish shift.
- Plot SMA(50) and SMA(200) on weekly Bitcoin charts
- Observe whether the price respects these levels during pullbacks
- Combine with fundamental analysis to enhance decision accuracy
By relying on these smoothed-out averages, investors can better assess whether Bitcoin is in a healthy uptrend or entering a correction phase.
Frequently Asked Questions
Can I use both EMA and SMA together for Bitcoin analysis?Yes, many traders combine both indicators to benefit from their respective strengths. Using EMA for entry timing and SMA for trend validation can improve trade accuracy.
Which timeframes work best for EMA and SMA in Bitcoin trading?Shorter timeframes like 1-hour or 4-hour charts suit EMA strategies, while daily or weekly charts are more appropriate for SMA-based decisions.
Do professional Bitcoin traders prefer EMA over SMA?There is no universal preference. Some professionals favor EMA for its responsiveness, while others trust SMA for its reliability in long-term scenarios.
How do I configure EMA and SMA settings for Bitcoin on trading platforms?Most platforms allow customization through built-in indicators. Select the desired period (e.g., 9, 21, 50, 200) and apply the indicator to the Bitcoin chart. Adjust according to your trading style.
Disclaimer:info@kdj.com
The information provided is not trading advice. kdj.com does not assume any responsibility for any investments made based on the information provided in this article. Cryptocurrencies are highly volatile and it is highly recommended that you invest with caution after thorough research!
If you believe that the content used on this website infringes your copyright, please contact us immediately (info@kdj.com) and we will delete it promptly.


- Bitcoin, eCash Fork, and Airdrop Dynamics: A Deep Dive into Crypto's Latest Controversies
- 2026-05-03 12:55:01
- Consensus 2026 Miami: Web3, Blockchain, Cryptocurrency, NFTs, Metaverse, Conference, May 5th — Where Wall Street Meets the Digital Frontier
- 2026-05-02 12:45:01
- Fed Holds Rates Steady, Triggering Bitcoin Price Drop Amidst Geopolitical Tensions
- 2026-05-01 06:45:01
- Bitcoin Miners Electrify the Grid: Ohio Gas Plant Acquisition Powers Up a New Era for Digital Gold
- 2026-05-01 00:45:01
- MegaETH's MEGA Token Hits the Big Apple: Setting New Performance Benchmarks for Real-Time Blockchain
- 2026-05-01 00:55:01
- Solana's Slippery Slope: Price Prediction Points to Resistance Loss and Potential Further Drops
- 2026-05-01 06:45:01
Related knowledge

What Is Crypto Bottom Indicator? How Do Traders Identify Market Lows?
Jul 21,2026 at 08:20am
Bitcoin Halving Mechanics1. Bitcoin’s protocol enforces a fixed issuance schedule where block rewards are cut in half approximately every 210,000 bloc...

What Is Crypto Trend Reversal Indicator? Which Signals Should You Watch?
Jul 24,2026 at 11:00am
Market Volatility Patterns1. Bitcoin price swings often exceed 5% within a single 24-hour window during high-liquidity events such as ETF inflow annou...

What Is Weekly Bitcoin Chart Indicator? Can It Predict Long-Term Trends?
Jul 22,2026 at 07:39am
Market Volatility Patterns1. Price swings in cryptocurrency markets often exceed 10% within a 24-hour window, driven by liquidity constraints and algo...

What Is 4 Hour Chart Indicator? Why Do Crypto Traders Use It?
Jul 23,2026 at 02:20pm
Market Volatility Patterns1. Bitcoin price swings often exceed 10% within a 24-hour window during high-liquidity events such as ETF approval announcem...

What Is Premium Index Indicator? Why Does It Matter in Futures Trading?
Jul 23,2026 at 06:59pm
Premium Index Definition and Composition1. The Premium Index is a real-time metric derived from the weighted average price difference between perpetua...

What Is Basis Indicator in Crypto Futures? How Do Traders Use It?
Jul 20,2026 at 11:59pm
Basis Indicator Definition and Core Mechanics1. The basis indicator measures the price difference between a cryptocurrency’s spot price and its corres...
What Is Crypto Bottom Indicator? How Do Traders Identify Market Lows?
Jul 21,2026 at 08:20am
Bitcoin Halving Mechanics1. Bitcoin’s protocol enforces a fixed issuance schedule where block rewards are cut in half approximately every 210,000 bloc...
What Is Crypto Trend Reversal Indicator? Which Signals Should You Watch?
Jul 24,2026 at 11:00am
Market Volatility Patterns1. Bitcoin price swings often exceed 5% within a single 24-hour window during high-liquidity events such as ETF inflow annou...
What Is Weekly Bitcoin Chart Indicator? Can It Predict Long-Term Trends?
Jul 22,2026 at 07:39am
Market Volatility Patterns1. Price swings in cryptocurrency markets often exceed 10% within a 24-hour window, driven by liquidity constraints and algo...
What Is 4 Hour Chart Indicator? Why Do Crypto Traders Use It?
Jul 23,2026 at 02:20pm
Market Volatility Patterns1. Bitcoin price swings often exceed 10% within a 24-hour window during high-liquidity events such as ETF approval announcem...
What Is Premium Index Indicator? Why Does It Matter in Futures Trading?
Jul 23,2026 at 06:59pm
Premium Index Definition and Composition1. The Premium Index is a real-time metric derived from the weighted average price difference between perpetua...
What Is Basis Indicator in Crypto Futures? How Do Traders Use It?
Jul 20,2026 at 11:59pm
Basis Indicator Definition and Core Mechanics1. The basis indicator measures the price difference between a cryptocurrency’s spot price and its corres...
See all articles


