-
 bitcoin
 $87959.907984 USD
1.34% -
 ethereum
 $2920.497338 USD
3.04% -
 tether
 $0.999775 USD
0.00% -
 xrp
xrp $2.237324 USD
8.12% -
 bnb
bnb $860.243768 USD
0.90% -
 solana
 $138.089498 USD
5.43% -
 usd-coin
 $0.999807 USD
0.01% -
 tron
tron $0.272801 USD
-1.53% -
 dogecoin
 $0.150904 USD
2.96% -
 cardano
 $0.421635 USD
1.97% -
 hyperliquid
 $32.152445 USD
2.23% -
 bitcoin-cash
 $533.301069 USD
-1.94% -
 chainlink
 $12.953417 USD
2.68% -
 unus-sed-leo
 $9.535951 USD
0.73% -
 zcash
zcash $521.483386 USD
-2.87%
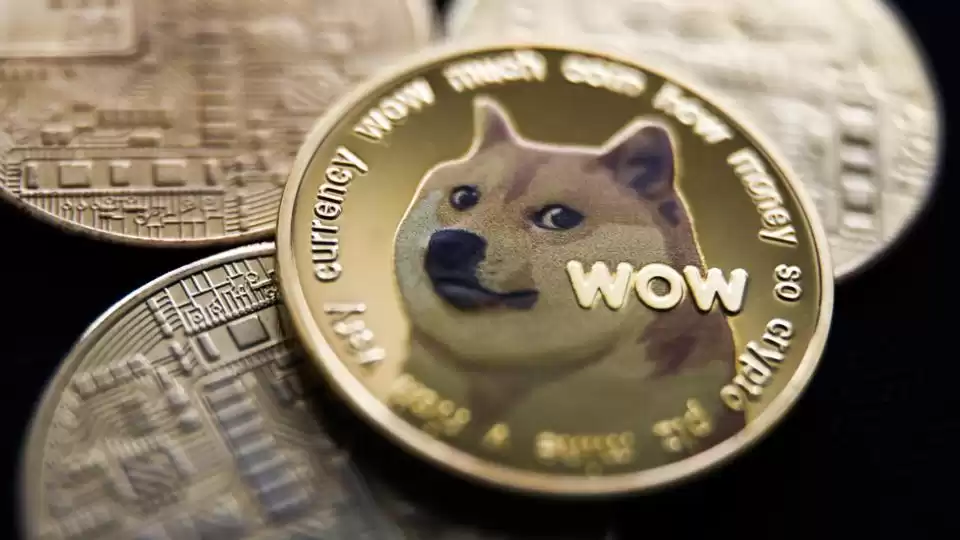
How to manage Dogecoin investment risks?
To mitigate Dogecoin investment risks, it's crucial to acknowledge its volatility, invest prudently, diversify, choose reputable platforms, employ stop-loss orders, avoid FOMO, and conduct thorough research.
Nov 01, 2024 at 04:10 pm

- Understand the Volatility of Dogecoin.
Dogecoin is a highly volatile cryptocurrency, meaning that its price can fluctuate significantly over short periods of time. This volatility can make it difficult to predict how much your investment will be worth.
- Invest Only What You Can Afford to Lose.
Given Dogecoin's volatility, it's important to only invest what you can afford to lose. If the price of Dogecoin drops, you could lose some or all of your investment.
- Diversify Your Investment Portfolio.
Avoid putting all of your eggs in one basket, so to speak. Instead, diversify your investment portfolio by investing in a variety of different cryptocurrencies and asset classes. This will help to reduce the risk of losing all of your money if one investment goes sour.
- Use a reputable trading platform.
When you're ready to start trading, do your research and choose a reputable cryptocurrency trading platform.
- Set Stop-Loss Orders.
A stop-loss order is an order to sell a certain number of coins once the price drops to a certain level. This can help to protect your profits if the price of Dogecoin falls.
- Don't FOMO.
FOMO, or fear of missing out, can lead to irrational investment decisions. Don't let the hype and fear of missing out cause you to make a rash decision.
- Do Your Own Research.
Before you decide to invest in Dogecoin, do your research and understand the risks involved. This will help you make an informed decision about whether or not Dogecoin is a good investment for you.
Disclaimer:info@kdj.com
The information provided is not trading advice. kdj.com does not assume any responsibility for any investments made based on the information provided in this article. Cryptocurrencies are highly volatile and it is highly recommended that you invest with caution after thorough research!
If you believe that the content used on this website infringes your copyright, please contact us immediately (info@kdj.com) and we will delete it promptly.
- Super Bowl LX: Coin Toss Trends Point to Tails Despite Heads' Recent Surge
- 2026-01-31 07:30:02
- Aussie Prospector's Ancient Find: Japanese Relics Surface, Rewriting Gold Rush Lore
- 2026-01-31 07:20:01
- US Mint Adjusts Coin Prices: Clad Collector Sets See Significant Hikes Amidst Special Anniversary Releases
- 2026-01-31 07:20:01
- THORChain Ignites Fiery Debate with CoinGecko Over Bitcoin DEX Definitions: A Battle for True Decentralization
- 2026-01-31 07:15:01
- Fantasy Football Frenzy: Key Picks and Pointers for Premier League Round 24
- 2026-01-31 06:40:02
- Cryptocurrencies Brace for Potential Plunge in 2026 Amidst Market Volatility
- 2026-01-31 07:15:01
Related knowledge

How to Develop a Crypto Exit Strategy to Secure Your Profits?
Jan 22,2026 at 10:19am
Understanding Market Cycles and Timing1. Cryptocurrency markets operate in distinct phases: accumulation, markup, distribution, and markdown. Recogniz...

How to Find and Invest in Promising DePIN Crypto Projects?
Jan 19,2026 at 06:19pm
Understanding DePIN Fundamentals1. DePIN stands for Decentralized Physical Infrastructure Networks, combining real-world hardware deployment with bloc...

How to Find Liquidity Pools with the Lowest Impermanent Loss Risk?
Jan 25,2026 at 05:59pm
Fundamental Characteristics of Low-Risk Liquidity Pools1. Stablecoin pairs dominate the lowest impermanent loss environments due to minimal price dive...

How to Analyze Market Sentiment Using the Crypto Fear & Greed Index?
Jan 24,2026 at 09:39am
Understanding the Crypto Fear & Greed Index1. The Crypto Fear & Greed Index is a composite metric that aggregates data from multiple sources including...

How to Hedge Your Crypto Portfolio Against a Market Crash?
Jan 19,2026 at 03:40pm
Risk Assessment and Portfolio Allocation1. Determine the total exposure to high-volatility assets such as memecoins or newly launched tokens without a...

How to Use Technical Analysis for Short-Term Bitcoin Trades?
Jan 25,2026 at 01:00pm
Understanding Candlestick Patterns1. Bullish engulfing formations often appear after a sustained downtrend and signal potential reversal points where ...

How to Develop a Crypto Exit Strategy to Secure Your Profits?
Jan 22,2026 at 10:19am
Understanding Market Cycles and Timing1. Cryptocurrency markets operate in distinct phases: accumulation, markup, distribution, and markdown. Recogniz...

How to Find and Invest in Promising DePIN Crypto Projects?
Jan 19,2026 at 06:19pm
Understanding DePIN Fundamentals1. DePIN stands for Decentralized Physical Infrastructure Networks, combining real-world hardware deployment with bloc...

How to Find Liquidity Pools with the Lowest Impermanent Loss Risk?
Jan 25,2026 at 05:59pm
Fundamental Characteristics of Low-Risk Liquidity Pools1. Stablecoin pairs dominate the lowest impermanent loss environments due to minimal price dive...

How to Analyze Market Sentiment Using the Crypto Fear & Greed Index?
Jan 24,2026 at 09:39am
Understanding the Crypto Fear & Greed Index1. The Crypto Fear & Greed Index is a composite metric that aggregates data from multiple sources including...

How to Hedge Your Crypto Portfolio Against a Market Crash?
Jan 19,2026 at 03:40pm
Risk Assessment and Portfolio Allocation1. Determine the total exposure to high-volatility assets such as memecoins or newly launched tokens without a...

How to Use Technical Analysis for Short-Term Bitcoin Trades?
Jan 25,2026 at 01:00pm
Understanding Candlestick Patterns1. Bullish engulfing formations often appear after a sustained downtrend and signal potential reversal points where ...
See all articles


