


-
 bitcoin
 $87959.907984 USD
1.34% - ethereum
$2920.497338 USD
3.04% - tether
$0.999775 USD
0.00% - xrp
$2.237324 USD
8.12% - bnb
$860.243768 USD
0.90% - solana
$138.089498 USD
5.43% - usd-coin
$0.999807 USD
0.01% - tron
$0.272801 USD
-1.53% - dogecoin
$0.150904 USD
2.96% - cardano
$0.421635 USD
1.97% - hyperliquid
$32.152445 USD
2.23% - bitcoin-cash
$533.301069 USD
-1.94% - chainlink
$12.953417 USD
2.68% - unus-sed-leo
$9.535951 USD
0.73% - zcash
$521.483386 USD
-2.87%


What is a candlestick chart and what role does it play in crypto market analysis?
The K-line chart is an important tool for analyzing the cryptocurrency market, which can identify trends, determine support resistance levels, analyze market sentiment, and formulate trading strategies.
Apr 03, 2025 at 02:26 pm
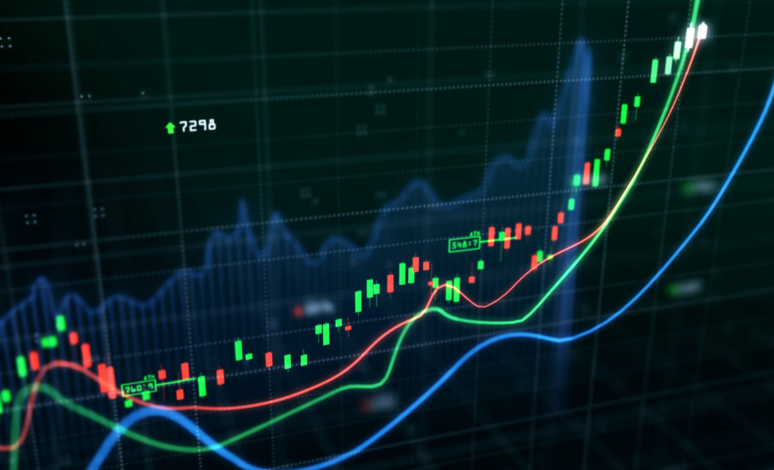
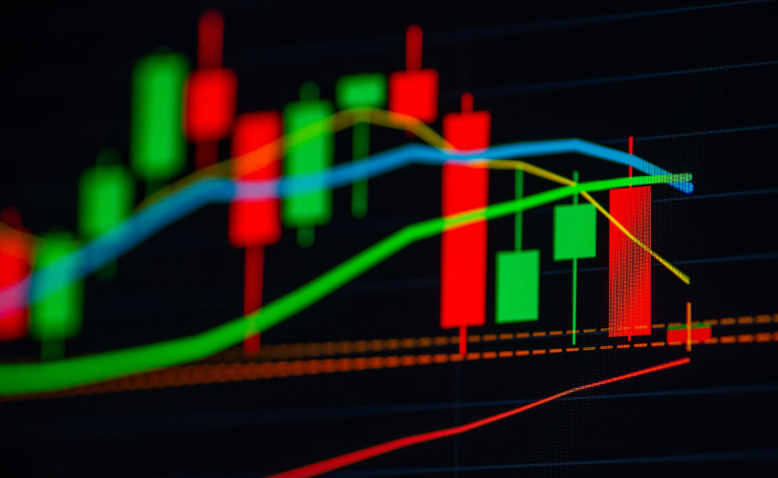
K-line chart, also known as candle chart, is a form of chart used to display changes in the price of financial products. In the cryptocurrency market, K-line charts are widely used to analyze the price trends of digital assets such as Bitcoin and Ethereum. This article will introduce in detail the basic structure, types of K-line charts and their specific role in encryption market analysis.
The basic structure of the K-line chart
The K-line chart consists of a series of figures called 'candles', each representing price changes over a period of time. Each candle contains the following key elements:
Opening price (Open): The price at the beginning of a period of time.
Close : The price at the end of a period of time.
Highest price : the highest price during this period.
Lowest price : the lowest price during this period.
According to the relationship between the closing price and the opening price, the K-line can be divided into the following two types:
Positive line : The closing price is higher than the opening price, usually represented by hollow or green, indicating that the price is rising.
Negative line : The closing price is lower than the opening price, usually represented in solid or red, indicating a price decline.
Types of K-line charts
K-line charts can be divided into various types according to different time frames, common ones include:
Minute chart : such as 1-minute chart, 5-minute chart, 15-minute chart, etc., suitable for short-term traders.
Hour chart : such as 1-hour chart, 4-hour chart, etc., suitable for medium- and short-term traders.
Daily chart : Daily price changes, suitable for medium and long-term traders.
Weekly and Monthly charts : suitable for long-term investors.
K-line charts with different time frames can help traders analyze market trends from different angles.
The role of K-line chart in crypto market analysis
In the cryptocurrency market, the K-line chart is an important tool for analyzing the market, and its role is mainly reflected in the following aspects:
Identify trends : By observing the K-line chart, traders can identify the upward trend, downward trend or consolidation trend of the market. For example, the continuous positive lines may indicate that the market enters an upward phase, while the continuous negative lines may indicate that the market enters a downward phase.
Determine support and resistance levels : A K-line chart can help traders identify important support and resistance levels that are often obstacles that prices encounter when they rise or fall. Support is a point that is difficult for the price to fall below, while resistance is a point that is difficult for the price to break through.
Analyze market sentiment : The K-line chart can reflect the sentiment of market participants. For example, a long upper shadow may indicate a greater selling pressure, while a long lower shadow may indicate a stronger buying force.
Formulate trading strategies : Through the analysis of the K-line chart, traders can formulate trading strategies that suit them. For example, use the K-line pattern (such as head and shoulders top, double bottom, etc.) to determine the entry and exit points.
Common K-line patterns and their significance
In crypto market analysis, identifying and understanding common K-line patterns is crucial to formulating trading strategies. The following are several common K-line patterns and their significance:
Hammer : Appears in a downtrend with a long lower shadow and small entities that indicate possible reversals.
Hanging Man : Appears in an upward trend, with a pattern similar to the hammer line, but indicates a possible decline.
Engulfing Pattern : It consists of two K-lines, and the latter K-line completely covers the entity of the previous K-line. The bullish engulf appears in the downward trend, and the bearish engulf appears in the upward trend.
Doji : The opening and closing prices are almost the same, indicating that the market may enter a consolidation stage or a reversal is about to occur.
How to use K-line charts on cryptocurrency trading platforms
In actual operation, traders can conduct market analysis through the K-line chart tool on the cryptocurrency trading platform. Here are the specific steps for using a K-line chart for analysis:
Select a time frame : Choose a suitable time frame according to your trading style, such as minute charts, hour charts, daily charts, etc.
Observe the K-line pattern : carefully observe the K-line chart and identify common K-line patterns, such as hammer lines, engulfing patterns, etc.
Combined with other technical indicators : In order to improve the accuracy of the analysis, other technical indicators can be combined, such as moving averages, relative strength index (RSI), etc.
Formulate a trading plan : Based on the analysis results of the K-line chart, formulate specific entry and exit strategies, including stop loss and take-profit points.
Disclaimer:info@kdj.com
The information provided is not trading advice. kdj.com does not assume any responsibility for any investments made based on the information provided in this article. Cryptocurrencies are highly volatile and it is highly recommended that you invest with caution after thorough research!
If you believe that the content used on this website infringes your copyright, please contact us immediately (info@kdj.com) and we will delete it promptly.


- Bitcoin, eCash Fork, and Airdrop Dynamics: A Deep Dive into Crypto's Latest Controversies
- 2026-05-03 12:55:01
- Consensus 2026 Miami: Web3, Blockchain, Cryptocurrency, NFTs, Metaverse, Conference, May 5th — Where Wall Street Meets the Digital Frontier
- 2026-05-02 12:45:01
- Fed Holds Rates Steady, Triggering Bitcoin Price Drop Amidst Geopolitical Tensions
- 2026-05-01 06:45:01
- Bitcoin Miners Electrify the Grid: Ohio Gas Plant Acquisition Powers Up a New Era for Digital Gold
- 2026-05-01 00:45:01
- MegaETH's MEGA Token Hits the Big Apple: Setting New Performance Benchmarks for Real-Time Blockchain
- 2026-05-01 00:55:01
- Solana's Slippery Slope: Price Prediction Points to Resistance Loss and Potential Further Drops
- 2026-05-01 06:45:01
Related knowledge

What Is the Best Aptos Investment Strategy in a Bull Market?
Jul 30,2026 at 06:37pm
High-Throughput DeFi Participation1. Deploy capital across multiple liquidity pools on LiquidSwap and AUX Swap to capture yield from both transaction ...

How Much SUI Should You Stake for Maximum Rewards?
Jul 23,2026 at 11:40am
Staking Mechanics on the Sui Network1. Sui employs a delegated proof-of-stake (DPoS) consensus model where validators are elected based on staked SUI ...

Should You Buy SUI Before the Next Ecosystem Expansion?
Jul 28,2026 at 11:19am
Tokenomics and Supply Mechanics1. SUI’s circulating supply is governed by a fixed emission schedule tied to validator rewards and ecosystem incentives...

What Is the Best Sui Investment Strategy for New Crypto Investors?
Jul 22,2026 at 03:00am
Understanding Sui’s Core Infrastructure1. Sui Network operates as a Layer 1 blockchain built on an object-centric data model, diverging from tradition...

How Much TON Should You Hold for Long-Term Growth?
Jul 22,2026 at 02:59pm
Market Positioning and Historical Context1. TON’s ecosystem has demonstrated consistent protocol-level upgrades since its integration with Telegram’s ...

Should You Buy TON After Recent Price Movements?
Jul 24,2026 at 04:59am
Market Context and Recent Price Behavior1. TON’s price surged over 27% within a 48-hour window following Telegram’s announcement of increased wallet i...
What Is the Best Aptos Investment Strategy in a Bull Market?
Jul 30,2026 at 06:37pm
High-Throughput DeFi Participation1. Deploy capital across multiple liquidity pools on LiquidSwap and AUX Swap to capture yield from both transaction ...
How Much SUI Should You Stake for Maximum Rewards?
Jul 23,2026 at 11:40am
Staking Mechanics on the Sui Network1. Sui employs a delegated proof-of-stake (DPoS) consensus model where validators are elected based on staked SUI ...
Should You Buy SUI Before the Next Ecosystem Expansion?
Jul 28,2026 at 11:19am
Tokenomics and Supply Mechanics1. SUI’s circulating supply is governed by a fixed emission schedule tied to validator rewards and ecosystem incentives...
What Is the Best Sui Investment Strategy for New Crypto Investors?
Jul 22,2026 at 03:00am
Understanding Sui’s Core Infrastructure1. Sui Network operates as a Layer 1 blockchain built on an object-centric data model, diverging from tradition...
How Much TON Should You Hold for Long-Term Growth?
Jul 22,2026 at 02:59pm
Market Positioning and Historical Context1. TON’s ecosystem has demonstrated consistent protocol-level upgrades since its integration with Telegram’s ...
Should You Buy TON After Recent Price Movements?
Jul 24,2026 at 04:59am
Market Context and Recent Price Behavior1. TON’s price surged over 27% within a 48-hour window following Telegram’s announcement of increased wallet i...
See all articles


