


![[record version]](/uploads/2026/07/26/cryptocurrencies-news/videos/origin_6a65c837a0992_image_500_375.webp "[record version]")


-
 bitcoin
 $87959.907984 USD
1.34% - ethereum
$2920.497338 USD
3.04% - tether
$0.999775 USD
0.00% - xrp
$2.237324 USD
8.12% - bnb
$860.243768 USD
0.90% - solana
$138.089498 USD
5.43% - usd-coin
$0.999807 USD
0.01% - tron
$0.272801 USD
-1.53% - dogecoin
$0.150904 USD
2.96% - cardano
$0.421635 USD
1.97% - hyperliquid
$32.152445 USD
2.23% - bitcoin-cash
$533.301069 USD
-1.94% - chainlink
$12.953417 USD
2.68% - unus-sed-leo
$9.535951 USD
0.73% - zcash
$521.483386 USD
-2.87%


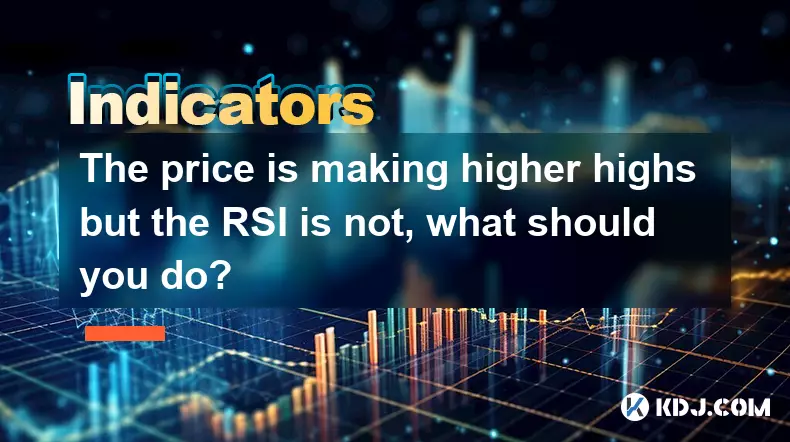
The price is making higher highs but the RSI is not, what should you do?
Bearish RSI divergence—price makes higher highs while RSI fails to, especially near >70—signals weakening momentum and heightened reversal risk in crypto markets.
Dec 24, 2025 at 09:40 pm
Bearish Divergence Signals
1. A price chart showing successive higher highs while the RSI fails to surpass its prior peak indicates bearish divergence.
2. This pattern often reflects weakening upward momentum despite continued price expansion.
3. Traders in the cryptocurrency market frequently interpret this as a warning that buying pressure is diminishing.
4. In Bitcoin or Ethereum charts, such divergence has preceded sharp corrections during bull runs.
5. It does not guarantee an immediate reversal but suggests caution before adding long positions.
RSI Threshold Behavior
1. When divergence occurs near overbought territory—typically above 70—the risk of pullback increases significantly.
2. Many altcoin rallies exhibit this behavior just before major liquidation cascades on perpetual futures markets.
3. A failure of RSI to break above 75 during a new price high adds weight to the bearish interpretation.
4. Some traders combine this with volume analysis: declining volume on new highs strengthens the divergence signal.
5. On-chain metrics like exchange inflows may rise concurrently, hinting at distribution by large holders.
Position Management Tactics
1. Reducing exposure gradually rather than exiting entirely allows participation if strength persists.
2. Moving stop-loss orders to breakeven or slightly above recent swing lows protects capital without premature exit.
3. Traders often hedge with short-dated put options on BTC or ETH futures when divergence appears on daily charts.
4. Scaling out of leveraged long positions becomes critical when funding rates remain elevated alongside divergence.
5. Some funds rebalance into stablecoin-denominated yield strategies during such setups to preserve purchasing power.
Chart Timeframe Alignment
1. Divergence on the 4-hour chart gains more reliability when confirmed by similar patterns on the daily timeframe.
2. Spot markets and perpetual swap order books often show imbalance—increasing bid-ask spreads—as divergence matures.
3. Lower timeframes like 15-minute charts may generate false signals; confirmation from higher frames is essential.
4. Whale wallet activity tends to shift toward accumulation zones below key moving averages during late-stage divergence.
5. Candlestick rejection patterns—such as shooting stars or bearish engulfing—gain significance when aligned with RSI divergence.
Frequently Asked Questions
Q1. Does bearish RSI divergence always lead to price decline?Not necessarily. Price can consolidate or grind sideways for extended periods before reversing. Historical data shows divergence precedes roughly 68% of meaningful corrections across top 20 cryptocurrencies by market cap.
Q2. Can divergence occur during strong uptrends without immediate reversal?Yes. Extended momentum phases—like BTC’s 2020–2021 rally—saw multiple divergences before final exhaustion. Each occurrence increased statistical probability of correction but did not dictate timing.
Q3. How does leverage affect divergence interpretation in crypto markets?Leverage amplifies both risk and signal sensitivity. High open interest combined with divergence often correlates with faster, deeper liquidations. Funding rate spikes add confirmation weight.
Q4. Is RSI divergence more reliable on spot or derivatives charts?Derivatives charts—especially perpetual futures—tend to reflect crowd positioning more directly. Spot price divergence may lag due to arbitrage delays and exchange-specific liquidity fragmentation.
Disclaimer:info@kdj.com
The information provided is not trading advice. kdj.com does not assume any responsibility for any investments made based on the information provided in this article. Cryptocurrencies are highly volatile and it is highly recommended that you invest with caution after thorough research!
If you believe that the content used on this website infringes your copyright, please contact us immediately (info@kdj.com) and we will delete it promptly.


- Bitcoin, eCash Fork, and Airdrop Dynamics: A Deep Dive into Crypto's Latest Controversies
- 2026-05-03 12:55:01
- Consensus 2026 Miami: Web3, Blockchain, Cryptocurrency, NFTs, Metaverse, Conference, May 5th — Where Wall Street Meets the Digital Frontier
- 2026-05-02 12:45:01
- Fed Holds Rates Steady, Triggering Bitcoin Price Drop Amidst Geopolitical Tensions
- 2026-05-01 06:45:01
- Bitcoin Miners Electrify the Grid: Ohio Gas Plant Acquisition Powers Up a New Era for Digital Gold
- 2026-05-01 00:45:01
- MegaETH's MEGA Token Hits the Big Apple: Setting New Performance Benchmarks for Real-Time Blockchain
- 2026-05-01 00:55:01
- Solana's Slippery Slope: Price Prediction Points to Resistance Loss and Potential Further Drops
- 2026-05-01 06:45:01
Related knowledge

What Is Crypto Bottom Indicator? How Do Traders Identify Market Lows?
Jul 21,2026 at 08:20am
Bitcoin Halving Mechanics1. Bitcoin’s protocol enforces a fixed issuance schedule where block rewards are cut in half approximately every 210,000 bloc...

What Is Crypto Trend Reversal Indicator? Which Signals Should You Watch?
Jul 24,2026 at 11:00am
Market Volatility Patterns1. Bitcoin price swings often exceed 5% within a single 24-hour window during high-liquidity events such as ETF inflow annou...

What Is Weekly Bitcoin Chart Indicator? Can It Predict Long-Term Trends?
Jul 22,2026 at 07:39am
Market Volatility Patterns1. Price swings in cryptocurrency markets often exceed 10% within a 24-hour window, driven by liquidity constraints and algo...

What Is 4 Hour Chart Indicator? Why Do Crypto Traders Use It?
Jul 23,2026 at 02:20pm
Market Volatility Patterns1. Bitcoin price swings often exceed 10% within a 24-hour window during high-liquidity events such as ETF approval announcem...

What Is Premium Index Indicator? Why Does It Matter in Futures Trading?
Jul 23,2026 at 06:59pm
Premium Index Definition and Composition1. The Premium Index is a real-time metric derived from the weighted average price difference between perpetua...

What Is Basis Indicator in Crypto Futures? How Do Traders Use It?
Jul 20,2026 at 11:59pm
Basis Indicator Definition and Core Mechanics1. The basis indicator measures the price difference between a cryptocurrency’s spot price and its corres...
What Is Crypto Bottom Indicator? How Do Traders Identify Market Lows?
Jul 21,2026 at 08:20am
Bitcoin Halving Mechanics1. Bitcoin’s protocol enforces a fixed issuance schedule where block rewards are cut in half approximately every 210,000 bloc...
What Is Crypto Trend Reversal Indicator? Which Signals Should You Watch?
Jul 24,2026 at 11:00am
Market Volatility Patterns1. Bitcoin price swings often exceed 5% within a single 24-hour window during high-liquidity events such as ETF inflow annou...
What Is Weekly Bitcoin Chart Indicator? Can It Predict Long-Term Trends?
Jul 22,2026 at 07:39am
Market Volatility Patterns1. Price swings in cryptocurrency markets often exceed 10% within a 24-hour window, driven by liquidity constraints and algo...
What Is 4 Hour Chart Indicator? Why Do Crypto Traders Use It?
Jul 23,2026 at 02:20pm
Market Volatility Patterns1. Bitcoin price swings often exceed 10% within a 24-hour window during high-liquidity events such as ETF approval announcem...
What Is Premium Index Indicator? Why Does It Matter in Futures Trading?
Jul 23,2026 at 06:59pm
Premium Index Definition and Composition1. The Premium Index is a real-time metric derived from the weighted average price difference between perpetua...
What Is Basis Indicator in Crypto Futures? How Do Traders Use It?
Jul 20,2026 at 11:59pm
Basis Indicator Definition and Core Mechanics1. The basis indicator measures the price difference between a cryptocurrency’s spot price and its corres...
See all articles


