


![[record version]](/uploads/2026/07/26/cryptocurrencies-news/videos/origin_6a65c837a0992_image_500_375.webp "[record version]")


-
 bitcoin
 $87959.907984 USD
1.34% - ethereum
$2920.497338 USD
3.04% - tether
$0.999775 USD
0.00% - xrp
$2.237324 USD
8.12% - bnb
$860.243768 USD
0.90% - solana
$138.089498 USD
5.43% - usd-coin
$0.999807 USD
0.01% - tron
$0.272801 USD
-1.53% - dogecoin
$0.150904 USD
2.96% - cardano
$0.421635 USD
1.97% - hyperliquid
$32.152445 USD
2.23% - bitcoin-cash
$533.301069 USD
-1.94% - chainlink
$12.953417 USD
2.68% - unus-sed-leo
$9.535951 USD
0.73% - zcash
$521.483386 USD
-2.87%


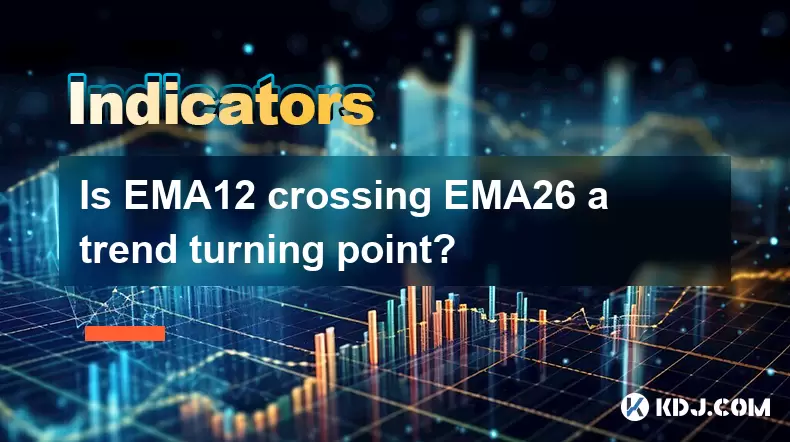
Is EMA12 crossing EMA26 a trend turning point?
The EMA12 and EMA26 crossover strategy helps crypto traders spot potential trend changes, with bullish or bearish signals when the lines cross, but works best when combined with other indicators like RSI or MACD to filter false signals.
Jun 22, 2025 at 01:14 pm
Understanding EMA12 and EMA26 in Cryptocurrency Trading
The Exponential Moving Average (EMA) is a popular technical indicator used by traders to identify potential trend changes. In the cryptocurrency market, where volatility is high and trends can reverse quickly, indicators like EMA12 (12-period EMA) and EMA26 (26-period EMA) are commonly used to assess momentum and direction.
These two EMAs are calculated based on recent price data, giving more weight to the latest prices. When the EMA12 crosses above or below the EMA26, it's often interpreted as a signal for a possible change in the trend direction. This phenomenon is sometimes referred to as the 'EMA crossover' strategy.
What Does an EMA Crossover Indicate?
An EMA12 crossing above EMA26 typically signals a shift from a bearish to a bullish trend, while the EMA12 crossing below EMA26 may indicate a move from bullish to bearish territory. Traders often use this as a trigger for entering or exiting positions.
However, it’s crucial to understand that these crossovers don't always result in significant trend reversals. The cryptocurrency market is known for its false signals and whipsaws, especially during sideways or choppy price action. Therefore, relying solely on this indicator without confirmation from other tools can lead to misleading decisions.
- EMA12 > EMA26: Often seen as a buy signal or bullish sign.
- EMA12 Considered a sell signal or bearish indication.
How Reliable Are EMA Crossovers in Crypto Markets?
Cryptocurrencies are inherently more volatile than traditional financial assets. As a result, EMA crossovers can be both effective and deceptive depending on the context. During strong trending phases, such as Bitcoin's bull runs, EMA12 crossing EMA26 can provide timely entries and exits. However, in ranging markets, multiple false signals may occur, leading to unnecessary trades.
It's also important to note that different timeframes yield varying results. For instance:
- On the 1-hour chart, EMA crossovers may offer short-term trade opportunities.
- On the daily chart, they might align better with long-term directional moves.
Traders should consider the broader market environment before acting on EMA-based signals. Tools like volume analysis, RSI, and MACD can help confirm whether a crossover is likely to result in a genuine trend reversal.
Combining EMA Crossovers with Other Indicators
To increase the accuracy of EMA-based trading strategies, many crypto traders combine them with additional indicators:
- Relative Strength Index (RSI): Helps determine overbought or oversold conditions alongside EMA crossovers.
- MACD: Since the MACD line itself is derived from EMA12 and EMA26, observing its histogram and signal line crossovers can reinforce the trend change hypothesis.
- Volume: A spike in volume during an EMA crossover can serve as a confirmation that institutional or large retail players are participating in the move.
For example, if the EMA12 crosses above EMA26 and the MACD line crosses above the signal line at the same time, the likelihood of a real trend change increases. Similarly, if volume surges, it adds credibility to the crossover signal.
Practical Steps to Trade Using EMA12 and EMA26 Crossovers
Here’s a step-by-step guide to applying the EMA12/EMA26 crossover strategy effectively in cryptocurrency trading:
- Select your preferred timeframe: Decide whether you're trading intraday, swing, or position trading. Choose a chart (e.g., 1H, 4H, or daily) accordingly.
- Add EMA12 and EMA26 to your chart: Most trading platforms like TradingView or Binance allow easy addition of moving averages through the indicators menu.
- Identify the crossover point: Watch for when the EMA12 line crosses above or below the EMA26 line. Mark these points for further analysis.
- Check for confluence: Look for supporting signals from other indicators like RSI, MACD, or volume spikes near the crossover zone.
- Set entry and exit levels: Place a buy order after a bullish crossover confirmed by other tools, or a sell order after a bearish crossover. Use stop-loss and take-profit levels based on recent support/resistance zones.
This method works best when integrated into a broader trading plan rather than being used in isolation.
Frequently Asked Questions
Q: Can EMA12 and EMA26 be used for all cryptocurrencies?Yes, these EMAs can be applied to any cryptocurrency chart. However, their effectiveness may vary based on the asset's liquidity and volatility. Major coins like BTC, ETH, and SOL tend to produce more reliable signals compared to smaller altcoins.
Q: Is there a way to reduce false signals when using EMA crossovers?Adding filters like volume confirmation or waiting for candlestick patterns to form after the crossover can help reduce false signals. Also, combining with other trend-following indicators like ADX can enhance reliability.
Q: Should I always act on an EMA12/EMA26 crossover?No. It’s advisable to wait for confirmation from other tools before entering a trade. Acting immediately on every crossover without validation can lead to losses, especially in sideways markets.
Q: What timeframes are best suited for EMA12 and EMA26 strategies?Short-term traders often use 5-minute or 1-hour charts for quick entries and exits. Mid-term traders prefer 4-hour or daily charts to capture larger moves. Ultimately, the choice depends on your trading style and goals.
Disclaimer:info@kdj.com
The information provided is not trading advice. kdj.com does not assume any responsibility for any investments made based on the information provided in this article. Cryptocurrencies are highly volatile and it is highly recommended that you invest with caution after thorough research!
If you believe that the content used on this website infringes your copyright, please contact us immediately (info@kdj.com) and we will delete it promptly.


- Bitcoin, eCash Fork, and Airdrop Dynamics: A Deep Dive into Crypto's Latest Controversies
- 2026-05-03 12:55:01
- Consensus 2026 Miami: Web3, Blockchain, Cryptocurrency, NFTs, Metaverse, Conference, May 5th — Where Wall Street Meets the Digital Frontier
- 2026-05-02 12:45:01
- Fed Holds Rates Steady, Triggering Bitcoin Price Drop Amidst Geopolitical Tensions
- 2026-05-01 06:45:01
- Bitcoin Miners Electrify the Grid: Ohio Gas Plant Acquisition Powers Up a New Era for Digital Gold
- 2026-05-01 00:45:01
- MegaETH's MEGA Token Hits the Big Apple: Setting New Performance Benchmarks for Real-Time Blockchain
- 2026-05-01 00:55:01
- Solana's Slippery Slope: Price Prediction Points to Resistance Loss and Potential Further Drops
- 2026-05-01 06:45:01
Related knowledge

What Is Crypto Bottom Indicator? How Do Traders Identify Market Lows?
Jul 21,2026 at 08:20am
Bitcoin Halving Mechanics1. Bitcoin’s protocol enforces a fixed issuance schedule where block rewards are cut in half approximately every 210,000 bloc...

What Is Crypto Trend Reversal Indicator? Which Signals Should You Watch?
Jul 24,2026 at 11:00am
Market Volatility Patterns1. Bitcoin price swings often exceed 5% within a single 24-hour window during high-liquidity events such as ETF inflow annou...

What Is Weekly Bitcoin Chart Indicator? Can It Predict Long-Term Trends?
Jul 22,2026 at 07:39am
Market Volatility Patterns1. Price swings in cryptocurrency markets often exceed 10% within a 24-hour window, driven by liquidity constraints and algo...

What Is 4 Hour Chart Indicator? Why Do Crypto Traders Use It?
Jul 23,2026 at 02:20pm
Market Volatility Patterns1. Bitcoin price swings often exceed 10% within a 24-hour window during high-liquidity events such as ETF approval announcem...

What Is Premium Index Indicator? Why Does It Matter in Futures Trading?
Jul 23,2026 at 06:59pm
Premium Index Definition and Composition1. The Premium Index is a real-time metric derived from the weighted average price difference between perpetua...

What Is Basis Indicator in Crypto Futures? How Do Traders Use It?
Jul 20,2026 at 11:59pm
Basis Indicator Definition and Core Mechanics1. The basis indicator measures the price difference between a cryptocurrency’s spot price and its corres...
What Is Crypto Bottom Indicator? How Do Traders Identify Market Lows?
Jul 21,2026 at 08:20am
Bitcoin Halving Mechanics1. Bitcoin’s protocol enforces a fixed issuance schedule where block rewards are cut in half approximately every 210,000 bloc...
What Is Crypto Trend Reversal Indicator? Which Signals Should You Watch?
Jul 24,2026 at 11:00am
Market Volatility Patterns1. Bitcoin price swings often exceed 5% within a single 24-hour window during high-liquidity events such as ETF inflow annou...
What Is Weekly Bitcoin Chart Indicator? Can It Predict Long-Term Trends?
Jul 22,2026 at 07:39am
Market Volatility Patterns1. Price swings in cryptocurrency markets often exceed 10% within a 24-hour window, driven by liquidity constraints and algo...
What Is 4 Hour Chart Indicator? Why Do Crypto Traders Use It?
Jul 23,2026 at 02:20pm
Market Volatility Patterns1. Bitcoin price swings often exceed 10% within a 24-hour window during high-liquidity events such as ETF approval announcem...
What Is Premium Index Indicator? Why Does It Matter in Futures Trading?
Jul 23,2026 at 06:59pm
Premium Index Definition and Composition1. The Premium Index is a real-time metric derived from the weighted average price difference between perpetua...
What Is Basis Indicator in Crypto Futures? How Do Traders Use It?
Jul 20,2026 at 11:59pm
Basis Indicator Definition and Core Mechanics1. The basis indicator measures the price difference between a cryptocurrency’s spot price and its corres...
See all articles


