


-
 bitcoin
 $87959.907984 USD
1.34% - ethereum
$2920.497338 USD
3.04% - tether
$0.999775 USD
0.00% - xrp
$2.237324 USD
8.12% - bnb
$860.243768 USD
0.90% - solana
$138.089498 USD
5.43% - usd-coin
$0.999807 USD
0.01% - tron
$0.272801 USD
-1.53% - dogecoin
$0.150904 USD
2.96% - cardano
$0.421635 USD
1.97% - hyperliquid
$32.152445 USD
2.23% - bitcoin-cash
$533.301069 USD
-1.94% - chainlink
$12.953417 USD
2.68% - unus-sed-leo
$9.535951 USD
0.73% - zcash
$521.483386 USD
-2.87%


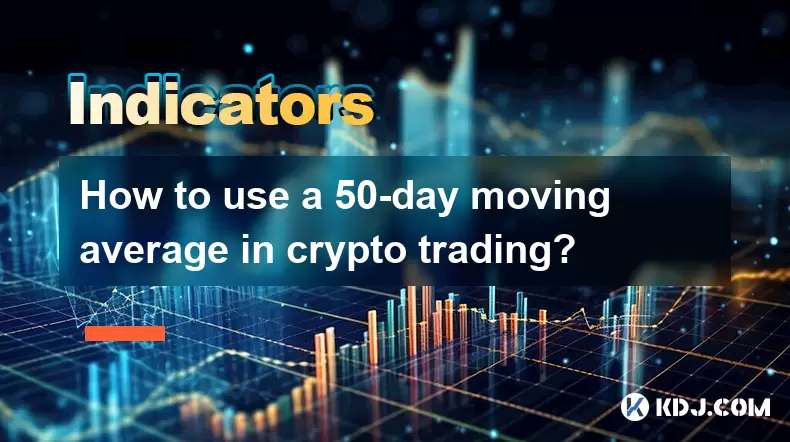
How to use a 50-day moving average in crypto trading?
The 50-day moving average helps crypto traders identify trends, with price above it signaling bullish momentum and below indicating bearish pressure.
Aug 05, 2025 at 11:29 pm
Understanding the 50-Day Moving Average in Crypto Markets
The 50-day moving average (50-DMA) is a widely used technical indicator in cryptocurrency trading that helps traders identify the direction of the current market trend. It calculates the average closing price of a cryptocurrency over the past 50 days and plots it as a continuous line on a price chart. This line smooths out short-term price fluctuations, making it easier to determine whether the market is in an uptrend or downtrend. When the price is consistently above the 50-DMA, it often signals bullish momentum. Conversely, when the price remains below the 50-DMA, it may indicate bearish sentiment.
Traders use the 50-DMA not only to assess trend direction but also to filter out market noise. Cryptocurrencies like Bitcoin (BTC) and Ethereum (ETH) are known for their high volatility, so using a moving average helps reduce false signals from sudden price spikes or dips. The 50-DMA is considered a medium-term indicator, making it ideal for swing traders and position traders who hold assets for days to weeks.
How to Apply the 50-Day Moving Average on Trading Platforms
To use the 50-DMA, traders must first access a charting platform such as TradingView, Binance, or CoinGecko Pro. These platforms allow users to overlay technical indicators on price charts. The process is straightforward:
- Open the cryptocurrency’s price chart on your preferred platform
- Click on the “Indicators” or “Studies” button, usually located at the top of the chart
- Search for “Moving Average” in the indicator library
- Select the Simple Moving Average (SMA) option
- Set the period to 50
- Choose a color for the line (commonly blue or red for visibility)
- Apply the indicator to the chart
Once applied, the 50-DMA will appear as a smooth curve tracking the average price. Some platforms allow customization, such as switching to an Exponential Moving Average (EMA), which gives more weight to recent prices. However, the SMA is often preferred for its simplicity and reliability in trend confirmation.
Using the 50-DMA for Trend Identification
One of the primary uses of the 50-DMA is to determine the prevailing market trend. When the current price is trading above the 50-DMA, it suggests that the asset is in a bullish phase. This condition often encourages traders to look for buying opportunities or hold existing positions. In contrast, when the price is below the 50-DMA, it indicates a bearish trend, which may prompt traders to consider selling or shorting the asset.
It’s important to note that the slope of the 50-DMA line itself can provide additional insight. A rising 50-DMA indicates strengthening upward momentum, while a declining 50-DMA suggests increasing downward pressure. Traders often combine this visual analysis with volume data to confirm whether the trend has strong support. For example, a rising price above the 50-DMA accompanied by increasing trading volume strengthens the case for a sustainable uptrend.
Generating Buy and Sell Signals with Crossovers
A popular strategy involving the 50-DMA is the moving average crossover. This technique involves comparing the 50-DMA with another moving average, typically the 200-day moving average (200-DMA). When the 50-DMA crosses above the 200-DMA, it generates a golden cross, widely interpreted as a long-term bullish signal. Conversely, when the 50-DMA crosses below the 200-DMA, it forms a death cross, signaling potential bearish momentum.
Traders can also use the 50-DMA in conjunction with shorter-term moving averages, such as the 20-DMA, for more responsive signals. For instance:
- A bullish crossover occurs when the 20-DMA moves above the 50-DMA, suggesting short-term momentum is shifting upward
- A bearish crossover happens when the 20-DMA drops below the 50-DMA, indicating short-term weakness
These signals are most effective when confirmed with other tools like Relative Strength Index (RSI) or MACD, helping reduce false entries in choppy markets.
Using the 50-DMA as Dynamic Support and Resistance
In trending markets, the 50-DMA often acts as a dynamic support level in uptrends and dynamic resistance in downtrends. During an uptrend, the price may pull back to test the 50-DMA before resuming its upward movement. If the price bounces off the 50-DMA with strong volume, it reinforces the trend’s validity. Traders may use these pullbacks as entry points.
In a downtrend, the 50-DMA can cap price rallies. If the price approaches the 50-DMA and fails to break above it, this retest can serve as a selling opportunity. It’s crucial to watch for rejection candles, such as bearish engulfing patterns or long upper wicks, near the 50-DMA to confirm resistance.
Combining the 50-DMA with Other Indicators for Better Accuracy
Relying solely on the 50-DMA can lead to misleading signals, especially in sideways or consolidating markets. To improve accuracy, traders often combine it with other technical tools:
- Volume indicators: Rising volume during a breakout above the 50-DMA adds credibility to the move
- RSI (Relative Strength Index): Helps identify overbought or oversold conditions when price approaches the 50-DMA
- Bollinger Bands: Can show whether the price is deviating significantly from the average, indicating potential reversals
- MACD (Moving Average Convergence Divergence): Confirms momentum shifts that align with 50-DMA crossovers
For example, if the price crosses above the 50-DMA and the MACD histogram turns positive while RSI exits oversold territory, the confluence of signals increases the probability of a successful trade.
Frequently Asked Questions
Can the 50-day moving average be used on timeframes shorter than daily?Yes, the 50-DMA can be applied to 4-hour, 1-hour, or even 15-minute charts. In such cases, it represents the average of the last 50 candles on that timeframe. However, its significance diminishes on lower timeframes due to increased noise. It remains most reliable on daily and weekly charts for trend analysis.
What happens if the price crosses the 50-DMA but quickly reverses?This is known as a false breakout or whipsaw. It often occurs during periods of low volume or consolidation. To avoid being misled, traders should wait for candle closure beyond the 50-DMA and seek confirmation from volume or momentum indicators before acting.
Is the 50-day moving average suitable for all cryptocurrencies?While applicable to most digital assets, its effectiveness varies. Major cryptocurrencies like BTC and ETH with high liquidity and clear trends respond well to the 50-DMA. Low-cap altcoins with erratic price movements may generate unreliable signals, requiring additional filtering.
Should I use the SMA or EMA for the 50-day moving average?The SMA treats all 50 days equally, offering a smoother line ideal for trend identification. The EMA reacts faster to recent price changes, which can be useful for short-term trading but may produce more false signals. Choice depends on trading style—SMA for stability, EMA for responsiveness.
Disclaimer:info@kdj.com
The information provided is not trading advice. kdj.com does not assume any responsibility for any investments made based on the information provided in this article. Cryptocurrencies are highly volatile and it is highly recommended that you invest with caution after thorough research!
If you believe that the content used on this website infringes your copyright, please contact us immediately (info@kdj.com) and we will delete it promptly.


- Bitcoin, eCash Fork, and Airdrop Dynamics: A Deep Dive into Crypto's Latest Controversies
- 2026-05-03 12:55:01
- Consensus 2026 Miami: Web3, Blockchain, Cryptocurrency, NFTs, Metaverse, Conference, May 5th — Where Wall Street Meets the Digital Frontier
- 2026-05-02 12:45:01
- Fed Holds Rates Steady, Triggering Bitcoin Price Drop Amidst Geopolitical Tensions
- 2026-05-01 06:45:01
- Bitcoin Miners Electrify the Grid: Ohio Gas Plant Acquisition Powers Up a New Era for Digital Gold
- 2026-05-01 00:45:01
- MegaETH's MEGA Token Hits the Big Apple: Setting New Performance Benchmarks for Real-Time Blockchain
- 2026-05-01 00:55:01
- Solana's Slippery Slope: Price Prediction Points to Resistance Loss and Potential Further Drops
- 2026-05-01 06:45:01
Related knowledge

What Is Crypto Top Indicator? Which Signals Show a Market Peak?
Jul 30,2026 at 06:59pm
Understanding Crypto Top Indicators1. Crypto top indicators are statistical tools designed to identify exhaustion points in upward price momentum befo...

What Is Crypto Bottom Indicator? How Do Traders Identify Market Lows?
Jul 21,2026 at 08:20am
Bitcoin Halving Mechanics1. Bitcoin’s protocol enforces a fixed issuance schedule where block rewards are cut in half approximately every 210,000 bloc...

What Is Crypto Trend Reversal Indicator? Which Signals Should You Watch?
Jul 24,2026 at 11:00am
Market Volatility Patterns1. Bitcoin price swings often exceed 5% within a single 24-hour window during high-liquidity events such as ETF inflow annou...

What Is Weekly Bitcoin Chart Indicator? Can It Predict Long-Term Trends?
Jul 22,2026 at 07:39am
Market Volatility Patterns1. Price swings in cryptocurrency markets often exceed 10% within a 24-hour window, driven by liquidity constraints and algo...

What Is Daily K Line Indicator? How Do You Analyze Daily Trends?
Jul 29,2026 at 09:06pm
Market Volatility Patterns1. Bitcoin price swings often exceed 10% within a 24-hour window during high-liquidity events such as ETF approval announcem...

What Is 4 Hour Chart Indicator? Why Do Crypto Traders Use It?
Jul 23,2026 at 02:20pm
Market Volatility Patterns1. Bitcoin price swings often exceed 10% within a 24-hour window during high-liquidity events such as ETF approval announcem...
What Is Crypto Top Indicator? Which Signals Show a Market Peak?
Jul 30,2026 at 06:59pm
Understanding Crypto Top Indicators1. Crypto top indicators are statistical tools designed to identify exhaustion points in upward price momentum befo...
What Is Crypto Bottom Indicator? How Do Traders Identify Market Lows?
Jul 21,2026 at 08:20am
Bitcoin Halving Mechanics1. Bitcoin’s protocol enforces a fixed issuance schedule where block rewards are cut in half approximately every 210,000 bloc...
What Is Crypto Trend Reversal Indicator? Which Signals Should You Watch?
Jul 24,2026 at 11:00am
Market Volatility Patterns1. Bitcoin price swings often exceed 5% within a single 24-hour window during high-liquidity events such as ETF inflow annou...
What Is Weekly Bitcoin Chart Indicator? Can It Predict Long-Term Trends?
Jul 22,2026 at 07:39am
Market Volatility Patterns1. Price swings in cryptocurrency markets often exceed 10% within a 24-hour window, driven by liquidity constraints and algo...
What Is Daily K Line Indicator? How Do You Analyze Daily Trends?
Jul 29,2026 at 09:06pm
Market Volatility Patterns1. Bitcoin price swings often exceed 10% within a 24-hour window during high-liquidity events such as ETF approval announcem...
What Is 4 Hour Chart Indicator? Why Do Crypto Traders Use It?
Jul 23,2026 at 02:20pm
Market Volatility Patterns1. Bitcoin price swings often exceed 10% within a 24-hour window during high-liquidity events such as ETF approval announcem...
See all articles


