


-
 bitcoin
 $87959.907984 USD
1.34% - ethereum
$2920.497338 USD
3.04% - tether
$0.999775 USD
0.00% - xrp
$2.237324 USD
8.12% - bnb
$860.243768 USD
0.90% - solana
$138.089498 USD
5.43% - usd-coin
$0.999807 USD
0.01% - tron
$0.272801 USD
-1.53% - dogecoin
$0.150904 USD
2.96% - cardano
$0.421635 USD
1.97% - hyperliquid
$32.152445 USD
2.23% - bitcoin-cash
$533.301069 USD
-1.94% - chainlink
$12.953417 USD
2.68% - unus-sed-leo
$9.535951 USD
0.73% - zcash
$521.483386 USD
-2.87%


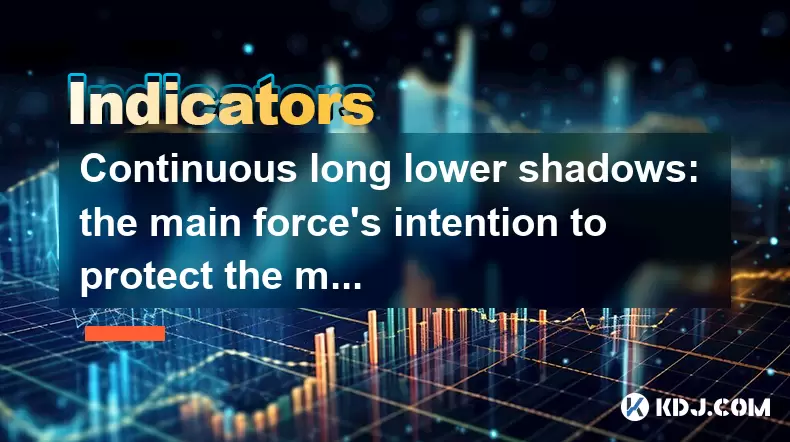
Continuous long lower shadows: the main force's intention to protect the market is obvious?
Continuous long lower shadows in crypto charts may signal the main force's effort to protect the market, indicating strong buying at lower levels to prevent significant declines.
May 31, 2025 at 04:28 am
In the world of cryptocurrency trading, chart patterns and candlestick formations play a crucial role in understanding market sentiment and potential price movements. One such pattern that traders often scrutinize is the continuous long lower shadows. This pattern can signal various intentions from the main force in the market, and one interpretation is that it reflects a strong intention to protect the market. Let's delve into this phenomenon and explore what it means for traders.
Understanding Long Lower Shadows
A candlestick with a long lower shadow indicates that the price dipped significantly during the trading period but managed to recover before the close. The long lower shadow suggests that selling pressure was strong at some point, but buyers stepped in to push the price back up. This can be interpreted as a sign of resilience in the market, where the main force, often large investors or institutions, may be actively working to prevent the price from falling too far.
The Main Force's Role in Market Protection
In the cryptocurrency market, the main force refers to entities with significant capital and influence, such as whales, institutional investors, or market makers. These players can have a substantial impact on price movements. When continuous long lower shadows appear, it may indicate that these main forces are actively buying at lower levels to prevent a more significant decline. This action can be seen as an effort to protect the market from excessive volatility and maintain stability.
Interpreting Continuous Long Lower Shadows
When traders observe continuous long lower shadows over several candlesticks, it suggests a pattern of repeated buying at lower levels. This can be interpreted in several ways:
- Bullish Signal: Continuous long lower shadows might indicate that the market is in a bullish phase, with strong buying interest at lower prices. This can be a sign that the main force is confident in the asset's future and is willing to support it.
- Support Level Testing: The pattern could also suggest that the main force is testing the market's support levels. By allowing the price to dip and then buying back, they can gauge the market's reaction and determine the strength of the support.
- Market Manipulation: In some cases, continuous long lower shadows might be a sign of market manipulation. The main force could be creating these patterns to shake out weaker hands and accumulate more of the asset at lower prices.
Trading Strategies Based on Long Lower Shadows
Traders can use the appearance of continuous long lower shadows to inform their trading strategies. Here are some approaches:
- Buying at Support: If the pattern indicates strong buying at lower levels, traders might consider buying near the bottom of the long lower shadows, anticipating a rebound.
- Setting Stop-Losses: Traders can also use the low points of the long lower shadows to set stop-loss orders, protecting their positions from significant downturns.
- Monitoring Volume: It's crucial to monitor trading volume alongside the long lower shadows. High volume during these periods can confirm the strength of the buying pressure.
Case Studies of Continuous Long Lower Shadows
To better understand how continuous long lower shadows play out in real-world scenarios, let's look at a few case studies from the cryptocurrency market:
- Bitcoin (BTC): In early 2021, Bitcoin exhibited multiple candlesticks with long lower shadows around the $30,000 level. This pattern was followed by a significant rally, suggesting that the main force was protecting the market and preparing for a bullish move.
- Ethereum (ETH): During a correction in mid-2021, Ethereum showed continuous long lower shadows around the $2,000 mark. The subsequent recovery indicated that the main force was actively buying at these levels, supporting the price and preventing a deeper fall.
Technical Analysis Tools to Confirm the Pattern
While continuous long lower shadows can provide valuable insights, it's essential to use additional technical analysis tools to confirm the pattern and the main force's intentions. Here are some tools that traders can use:
- Moving Averages: Comparing the price action to moving averages can help determine if the market is in a bullish or bearish trend. If the price is above key moving averages, it supports the bullish interpretation of long lower shadows.
- Relative Strength Index (RSI): The RSI can indicate whether the market is overbought or oversold. If the RSI shows oversold conditions during the formation of long lower shadows, it may confirm the buying pressure.
- Volume Indicators: High volume during the formation of long lower shadows can confirm the strength of the buying interest. Volume indicators like the On-Balance Volume (OBV) can provide additional insights.
Psychological Impact on Traders
The appearance of continuous long lower shadows can have a significant psychological impact on traders. When traders see these patterns, they may feel more confident in the market's stability and the main force's commitment to supporting the price. This can lead to increased buying interest and a self-fulfilling prophecy of price recovery. Conversely, if traders interpret the pattern as a sign of manipulation, it might lead to increased selling pressure and market volatility.
Risks and Considerations
While continuous long lower shadows can be a useful indicator, traders must also be aware of the risks and considerations:
- False Signals: Not all long lower shadows indicate a strong buying interest. Sometimes, they can be a result of temporary market fluctuations or manipulation.
- Market Context: The interpretation of long lower shadows should always consider the broader market context. For example, during a bear market, these patterns might not lead to a significant recovery.
- Overreliance on Patterns: Relying too heavily on any single pattern can lead to poor trading decisions. It's crucial to use a holistic approach, combining multiple indicators and analysis techniques.
Frequently Asked Questions
Q1: Can continuous long lower shadows appear in both bullish and bearish markets?Yes, continuous long lower shadows can appear in both bullish and bearish markets. In a bullish market, they often indicate strong buying interest at lower levels, while in a bearish market, they might suggest temporary support but not necessarily a reversal.
Q2: How can traders differentiate between genuine buying interest and market manipulation when seeing continuous long lower shadows?To differentiate between genuine buying interest and market manipulation, traders should look at additional indicators such as volume, RSI, and moving averages. High volume during the formation of long lower shadows can confirm genuine buying interest, while erratic volume patterns might suggest manipulation.
Q3: Are there specific cryptocurrencies where continuous long lower shadows are more common?Continuous long lower shadows can appear in any cryptocurrency, but they might be more common in highly liquid assets like Bitcoin and Ethereum due to the presence of more significant main forces and higher trading volumes.
Q4: How long should traders wait to confirm the impact of continuous long lower shadows?Traders should wait for at least a few candlesticks to confirm the impact of continuous long lower shadows. Observing the price action over several periods can help determine if the pattern leads to a sustained recovery or if it's just a temporary phenomenon.
Disclaimer:info@kdj.com
The information provided is not trading advice. kdj.com does not assume any responsibility for any investments made based on the information provided in this article. Cryptocurrencies are highly volatile and it is highly recommended that you invest with caution after thorough research!
If you believe that the content used on this website infringes your copyright, please contact us immediately (info@kdj.com) and we will delete it promptly.


- Bitcoin, eCash Fork, and Airdrop Dynamics: A Deep Dive into Crypto's Latest Controversies
- 2026-05-03 12:55:01
- Consensus 2026 Miami: Web3, Blockchain, Cryptocurrency, NFTs, Metaverse, Conference, May 5th — Where Wall Street Meets the Digital Frontier
- 2026-05-02 12:45:01
- Fed Holds Rates Steady, Triggering Bitcoin Price Drop Amidst Geopolitical Tensions
- 2026-05-01 06:45:01
- Bitcoin Miners Electrify the Grid: Ohio Gas Plant Acquisition Powers Up a New Era for Digital Gold
- 2026-05-01 00:45:01
- MegaETH's MEGA Token Hits the Big Apple: Setting New Performance Benchmarks for Real-Time Blockchain
- 2026-05-01 00:55:01
- Solana's Slippery Slope: Price Prediction Points to Resistance Loss and Potential Further Drops
- 2026-05-01 06:45:01
Related knowledge

What Is Crypto Bottom Indicator? How Do Traders Identify Market Lows?
Jul 21,2026 at 08:20am
Bitcoin Halving Mechanics1. Bitcoin’s protocol enforces a fixed issuance schedule where block rewards are cut in half approximately every 210,000 bloc...

What Is Crypto Trend Reversal Indicator? Which Signals Should You Watch?
Jul 24,2026 at 11:00am
Market Volatility Patterns1. Bitcoin price swings often exceed 5% within a single 24-hour window during high-liquidity events such as ETF inflow annou...

What Is Weekly Bitcoin Chart Indicator? Can It Predict Long-Term Trends?
Jul 22,2026 at 07:39am
Market Volatility Patterns1. Price swings in cryptocurrency markets often exceed 10% within a 24-hour window, driven by liquidity constraints and algo...

What Is Daily K Line Indicator? How Do You Analyze Daily Trends?
Jul 29,2026 at 09:06pm
Market Volatility Patterns1. Bitcoin price swings often exceed 10% within a 24-hour window during high-liquidity events such as ETF approval announcem...

What Is 4 Hour Chart Indicator? Why Do Crypto Traders Use It?
Jul 23,2026 at 02:20pm
Market Volatility Patterns1. Bitcoin price swings often exceed 10% within a 24-hour window during high-liquidity events such as ETF approval announcem...

What Is Multi-Timeframe Analysis Indicator? Which Timeframe Is Best?
Jul 29,2026 at 08:31am
Market Volatility Patterns1. Bitcoin price swings often exceed 10% within a 24-hour window during high-liquidity events such as ETF approval announcem...
What Is Crypto Bottom Indicator? How Do Traders Identify Market Lows?
Jul 21,2026 at 08:20am
Bitcoin Halving Mechanics1. Bitcoin’s protocol enforces a fixed issuance schedule where block rewards are cut in half approximately every 210,000 bloc...
What Is Crypto Trend Reversal Indicator? Which Signals Should You Watch?
Jul 24,2026 at 11:00am
Market Volatility Patterns1. Bitcoin price swings often exceed 5% within a single 24-hour window during high-liquidity events such as ETF inflow annou...
What Is Weekly Bitcoin Chart Indicator? Can It Predict Long-Term Trends?
Jul 22,2026 at 07:39am
Market Volatility Patterns1. Price swings in cryptocurrency markets often exceed 10% within a 24-hour window, driven by liquidity constraints and algo...
What Is Daily K Line Indicator? How Do You Analyze Daily Trends?
Jul 29,2026 at 09:06pm
Market Volatility Patterns1. Bitcoin price swings often exceed 10% within a 24-hour window during high-liquidity events such as ETF approval announcem...
What Is 4 Hour Chart Indicator? Why Do Crypto Traders Use It?
Jul 23,2026 at 02:20pm
Market Volatility Patterns1. Bitcoin price swings often exceed 10% within a 24-hour window during high-liquidity events such as ETF approval announcem...
What Is Multi-Timeframe Analysis Indicator? Which Timeframe Is Best?
Jul 29,2026 at 08:31am
Market Volatility Patterns1. Bitcoin price swings often exceed 10% within a 24-hour window during high-liquidity events such as ETF approval announcem...
See all articles


