


![[Multi SUB] |His soul has penetrated the King of Shu and is bound to the strongest system, giving him 108 shadow bodyguards and eighteen special forces at the beginning! He turned around to start an industry and run a newspaper, and ruined the aristocratic family and the prince. From then on, he grabbed the beauty of both the country and the country! ! #剧energychargingstation#MiniDrama#Wonderful mainland short drama](/uploads/2026/06/17/cryptocurrencies-news/videos/origin_6a3220c2ed276_image_500_375.webp "[Multi SUB] |His soul has penetrated the King of Shu and is bound to the strongest system, giving him 108 shadow bodyguards and eighteen special forces at the beginning! He turned around to start an industry and run a newspaper, and ruined the aristocratic family and the prince. From then on, he grabbed the beauty of both the country and the country! ! #剧energychargingstation#MiniDrama#Wonderful mainland short drama")


![[Awakening of Nations] The cavalry commander is quietly getting weaker? (Current performance and future development of the Cavalry)](/uploads/2026/06/17/cryptocurrencies-news/videos/origin_6a32257ba21bc_image_500_375.webp "[Awakening of Nations] The cavalry commander is quietly getting weaker? (Current performance and future development of the Cavalry)")


-
 bitcoin
 $87959.907984 USD
1.34% - ethereum
$2920.497338 USD
3.04% - tether
$0.999775 USD
0.00% - xrp
$2.237324 USD
8.12% - bnb
$860.243768 USD
0.90% - solana
$138.089498 USD
5.43% - usd-coin
$0.999807 USD
0.01% - tron
$0.272801 USD
-1.53% - dogecoin
$0.150904 USD
2.96% - cardano
$0.421635 USD
1.97% - hyperliquid
$32.152445 USD
2.23% - bitcoin-cash
$533.301069 USD
-1.94% - chainlink
$12.953417 USD
2.68% - unus-sed-leo
$9.535951 USD
0.73% - zcash
$521.483386 USD
-2.87%


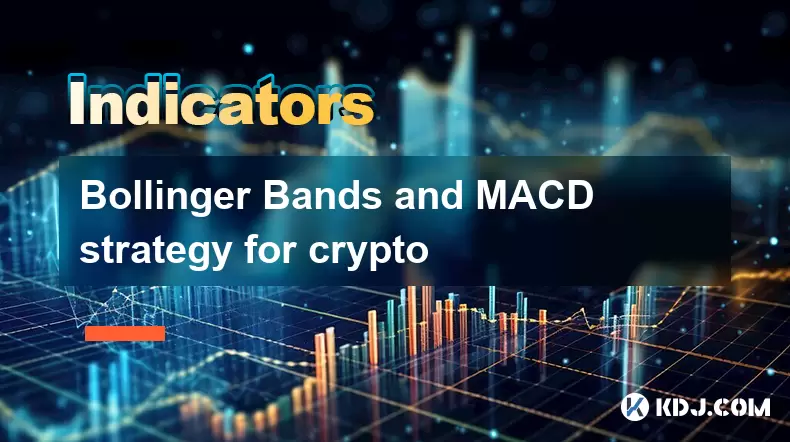
Bollinger Bands and MACD strategy for crypto
Bollinger Bands and MACD together offer a powerful strategy for crypto trading, helping identify entry points, manage risk, and confirm trends.
Jul 11, 2025 at 10:28 am
Understanding Bollinger Bands in Cryptocurrency Trading
Bollinger Bands are a popular technical analysis tool used by traders to identify volatility and potential price reversal points. In the context of cryptocurrency trading, they help assess whether an asset is overbought or oversold. The bands consist of three lines: a simple moving average (SMA) in the middle, with two standard deviation bands above and below it.
When prices touch or exceed the upper band, it may indicate that the asset is overbought, suggesting a possible pullback. Conversely, when prices fall near or below the lower band, it might signal that the asset is oversold, indicating a potential rebound. However, these signals should not be used in isolation, especially in highly volatile crypto markets.
It’s important to note that during strong trends, prices can remain outside the bands for extended periods without reversing. Therefore, combining Bollinger Bands with other indicators like MACD enhances their reliability.
Introduction to MACD in Crypto Analysis
The Moving Average Convergence Divergence (MACD) is another widely used momentum oscillator in crypto trading. It consists of three components: the MACD line, the signal line, and the histogram. These elements help traders identify trend direction, momentum shifts, and potential reversals.
The MACD line is calculated by subtracting the 26-period exponential moving average (EMA) from the 12-period EMA. The signal line is typically a 9-period EMA of the MACD line. When the MACD line crosses above the signal line, it generates a bullish signal; when it crosses below, it produces a bearish signal.
In highly volatile cryptocurrency markets, the MACD helps filter out false signals and confirms the strength of a trend. Traders also pay attention to divergences between the MACD and price action, which can hint at upcoming reversals.
Combining Bollinger Bands and MACD for Entry Signals
Using Bollinger Bands and MACD together creates a more robust trading strategy, especially in crypto assets that experience frequent swings in price and volume.
A common entry setup involves waiting for the price to touch or close beyond one of the Bollinger Bands while simultaneously observing the MACD for confirmation:
- If the price touches the lower Bollinger Band and the MACD line crosses above the signal line, this could signal a buy opportunity.
- Conversely, if the price hits the upper Bollinger Band and the MACD line crosses below the signal line, it might suggest a sell or short-sell opportunity.
Traders should ensure both conditions align before entering a trade. This dual confirmation helps reduce the risk of false breakouts and improves the probability of successful trades.
Setting Stop Loss and Take Profit Levels
Proper risk management is crucial when implementing the Bollinger Bands and MACD strategy in crypto trading. After identifying a valid entry point using both indicators, setting appropriate stop loss and take profit levels becomes essential.
For a long trade triggered by a bounce off the lower Bollinger Band and a bullish MACD crossover:
- Place the stop loss just below the recent swing low or slightly under the lower band.
- Set the take profit at the middle Bollinger Band or higher, depending on the strength of the trend.
For a short trade initiated at the upper Bollinger Band with a bearish MACD crossover:
- Position the stop loss slightly above the upper band or the recent swing high.
- Target the middle band or lower support levels as the take profit.
Adjustments may be necessary based on market volatility and individual risk tolerance. Using trailing stops can also help secure profits as the trade moves in your favor.
Backtesting the Strategy on Crypto Charts
Before applying the Bollinger Bands and MACD strategy in live crypto trading, it's advisable to perform backtesting on historical data. This allows traders to evaluate how the strategy would have performed in past market conditions.
To backtest effectively:
- Choose a crypto pair such as BTC/USDT or ETH/USDT.
- Use a platform like TradingView or MetaTrader that supports custom strategy testing.
- Apply the standard settings: 20-period Bollinger Bands with 2 standard deviations and MACD (12, 26, 9).
- Mark all instances where the price touched the bands and the MACD confirmed the move.
- Calculate win rate, average gain, and drawdowns to assess performance.
This process helps refine entry rules, optimize timeframes, and build confidence in the strategy before risking real capital.
Frequently Asked Questions
What timeframes work best for the Bollinger Bands and MACD strategy in crypto?This strategy performs well on intraday charts like 1-hour and 4-hour intervals. Daily charts can also be used for longer-term trades but tend to produce fewer signals.
Can I use this strategy on altcoins or only on major cryptocurrencies?Yes, the strategy works across various cryptocurrencies including altcoins. However, liquidity and volatility differences may affect performance, so testing is recommended for each asset.
Is it necessary to use the default Bollinger Bands and MACD settings?While the default settings (20-period and 2 std dev for BB, 12,26,9 for MACD) are widely accepted, some traders tweak them based on market conditions. Always test adjustments before live trading.
How do I handle conflicting signals between Bollinger Bands and MACD?If the indicators contradict each other—such as price touching the upper band but MACD showing bullish momentum—it’s safer to avoid the trade until clarity returns.
Disclaimer:info@kdj.com
The information provided is not trading advice. kdj.com does not assume any responsibility for any investments made based on the information provided in this article. Cryptocurrencies are highly volatile and it is highly recommended that you invest with caution after thorough research!
If you believe that the content used on this website infringes your copyright, please contact us immediately (info@kdj.com) and we will delete it promptly.


- Bitcoin, eCash Fork, and Airdrop Dynamics: A Deep Dive into Crypto's Latest Controversies
- 2026-05-03 12:55:01
- Consensus 2026 Miami: Web3, Blockchain, Cryptocurrency, NFTs, Metaverse, Conference, May 5th — Where Wall Street Meets the Digital Frontier
- 2026-05-02 12:45:01
- Fed Holds Rates Steady, Triggering Bitcoin Price Drop Amidst Geopolitical Tensions
- 2026-05-01 06:45:01
- Bitcoin Miners Electrify the Grid: Ohio Gas Plant Acquisition Powers Up a New Era for Digital Gold
- 2026-05-01 00:45:01
- MegaETH's MEGA Token Hits the Big Apple: Setting New Performance Benchmarks for Real-Time Blockchain
- 2026-05-01 00:55:01
- Solana's Slippery Slope: Price Prediction Points to Resistance Loss and Potential Further Drops
- 2026-05-01 06:45:01
Related knowledge

What Are the Most Popular Crypto Indicators in 2026? Which Ones Still Work?
Jun 15,2026 at 04:40pm
RSI: The Enduring Momentum Gauge1. RSI remains one of the most widely adopted indicators across all timeframes, from scalping to position trading. 2. ...

What Is the Aroon Indicator? Can It Help Predict New Trends?
Jun 13,2026 at 01:37am
Market Volatility Patterns1. Bitcoin price swings often exceed 5% within a single trading session during high-liquidity events such as ETF inflow anno...

How to Confirm Trend Reversals Before Entering a Trade?
Jun 12,2026 at 02:39pm
Market Volatility Patterns1. Bitcoin’s price movements often reflect macroeconomic signals such as Federal Reserve interest rate decisions and inflati...

What Is a Volume Spike? Does It Signal a Major Price Move?
Jun 14,2026 at 03:20pm
Understanding Volume Spikes in Cryptocurrency Markets1. A volume spike refers to a sudden and substantial increase in the number of tokens traded with...

How to Use K-Line Indicators During High Volatility Events?
Jun 13,2026 at 11:21pm
K-Line Structure Recognition in Extreme Market Conditions1. A single K-line during high volatility often exhibits abnormally long wicks, indicating ra...

What Is the Best Indicator Combination for Bitcoin Trading?
Jun 13,2026 at 08:20am
BTC.D and Market Phase Recognition1. BTC.D reflects the proportional weight of Bitcoin’s market capitalization against the aggregate crypto market cap...
What Are the Most Popular Crypto Indicators in 2026? Which Ones Still Work?
Jun 15,2026 at 04:40pm
RSI: The Enduring Momentum Gauge1. RSI remains one of the most widely adopted indicators across all timeframes, from scalping to position trading. 2. ...
What Is the Aroon Indicator? Can It Help Predict New Trends?
Jun 13,2026 at 01:37am
Market Volatility Patterns1. Bitcoin price swings often exceed 5% within a single trading session during high-liquidity events such as ETF inflow anno...
How to Confirm Trend Reversals Before Entering a Trade?
Jun 12,2026 at 02:39pm
Market Volatility Patterns1. Bitcoin’s price movements often reflect macroeconomic signals such as Federal Reserve interest rate decisions and inflati...
What Is a Volume Spike? Does It Signal a Major Price Move?
Jun 14,2026 at 03:20pm
Understanding Volume Spikes in Cryptocurrency Markets1. A volume spike refers to a sudden and substantial increase in the number of tokens traded with...
How to Use K-Line Indicators During High Volatility Events?
Jun 13,2026 at 11:21pm
K-Line Structure Recognition in Extreme Market Conditions1. A single K-line during high volatility often exhibits abnormally long wicks, indicating ra...
What Is the Best Indicator Combination for Bitcoin Trading?
Jun 13,2026 at 08:20am
BTC.D and Market Phase Recognition1. BTC.D reflects the proportional weight of Bitcoin’s market capitalization against the aggregate crypto market cap...
See all articles


