


![Xu Zhenzhen💞Wu Tianhao|He helps his neighbor casually on a rainy night. Who would have thought that he would be the dubbing master I have been chasing for many years? The male god was disabled in a car accident and suffered from low self-esteem and isolation. He was forced to pretend to be a couple to deal with the pressure to get married. I directly cured him and he finally stood up! [Sound caught in] #sweetpet #OverbearingPresident #Short drama #drama](/uploads/2026/06/18/cryptocurrencies-news/videos/origin_6a32ce38ba7ca_image_500_375.webp "Xu Zhenzhen💞Wu Tianhao|He helps his neighbor casually on a rainy night. Who would have thought that he would be the dubbing master I have been chasing for many years? The male god was disabled in a car accident and suffered from low self-esteem and isolation. He was forced to pretend to be a couple to deal with the pressure to get married. I directly cured him and he finally stood up! [Sound caught in] #sweetpet #OverbearingPresident #Short drama #drama")


-
 bitcoin
 $87959.907984 USD
1.34% - ethereum
$2920.497338 USD
3.04% - tether
$0.999775 USD
0.00% - xrp
$2.237324 USD
8.12% - bnb
$860.243768 USD
0.90% - solana
$138.089498 USD
5.43% - usd-coin
$0.999807 USD
0.01% - tron
$0.272801 USD
-1.53% - dogecoin
$0.150904 USD
2.96% - cardano
$0.421635 USD
1.97% - hyperliquid
$32.152445 USD
2.23% - bitcoin-cash
$533.301069 USD
-1.94% - chainlink
$12.953417 USD
2.68% - unus-sed-leo
$9.535951 USD
0.73% - zcash
$521.483386 USD
-2.87%


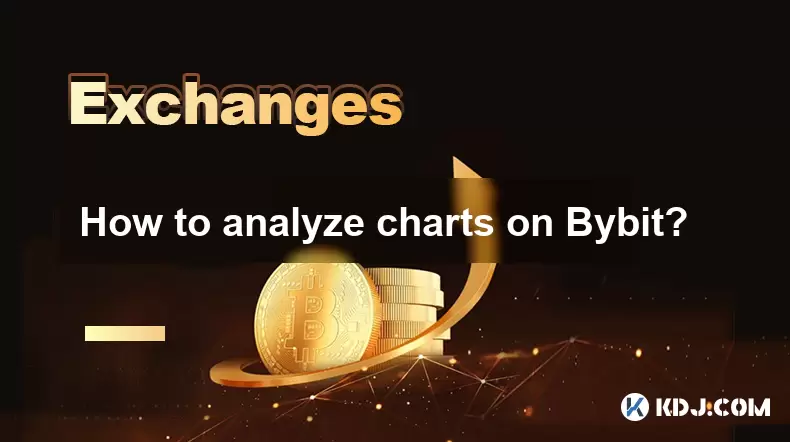
How to analyze charts on Bybit?
Bybit provides various charts like candlestick, line, and bar for crypto price analysis, along with technical indicators and customizable settings to improve trading decisions.
Jul 10, 2025 at 07:07 pm
Understanding Chart Types on Bybit
Bybit offers several types of charts that traders can use to analyze cryptocurrency price movements. The most commonly used chart type is the candlestick chart, which provides detailed information about price changes over time. Each candlestick represents a specific time interval and shows the open, high, low, and close prices for that period. Line charts are simpler and connect closing prices over time, while bar charts provide similar data to candlesticks but in a different visual format. Understanding how to interpret these charts is crucial for making informed trading decisions.
Navigating the Bybit Trading Interface
To begin analyzing charts on Bybit, you must first access the platform and navigate to the trading interface. Log in to your account and select the cryptocurrency pair you want to trade from the market list. Once selected, the chart will appear on the right side of the screen. You can customize the time frame by clicking on the interval options such as 1m, 5m, 15m, or larger intervals like 1d or 1w. Familiarizing yourself with the layout ensures efficient analysis without unnecessary delays.
- Click on the desired trading pair.
- Locate the chart section on the right-hand panel.
- Choose the preferred time interval from the top menu.
- Adjust display settings using the tools provided.
Using Technical Indicators for Analysis
Bybit integrates a wide range of technical indicators to help traders evaluate market trends and potential reversals. Popular indicators include Moving Averages (MA), Relative Strength Index (RSI), and Bollinger Bands. These tools overlay on the price chart and provide insights into momentum, volatility, and support/resistance levels. To add an indicator, click on the 'Indicators' button located at the top of the chart window and search for the desired tool. You can adjust parameters such as period length or color schemes to suit your preferences.
- Select the 'Indicators' tab.
- Search for the required indicator by name.
- Customize settings before applying it to the chart.
- Combine multiple indicators for more accurate readings.
Interpreting Candlestick Patterns
Candlestick patterns are essential for understanding market sentiment and predicting future price action. Common patterns like Doji, Hammer, and Engulfing formations indicate possible trend reversals or continuations. For example, a bullish engulfing pattern appears when a large green candle completely engulfs the previous red candle, suggesting a shift in momentum. Recognizing these patterns helps traders identify entry and exit points based on historical behavior rather than guesswork.
- Look for recurring candlestick shapes near key support/resistance areas.
- Confirm patterns using volume and other indicators.
- Avoid trading solely based on one candlestick signal.
- Practice identifying patterns across different time frames.
Setting Up Price Alerts and Annotations
Bybit allows users to set up price alerts and make annotations directly on the chart. This feature is useful for monitoring critical price levels without constantly watching the screen. To create a price alert, right-click on the chart at the desired level and choose 'Add Alert.' You can also draw trendlines, Fibonacci retracements, and horizontal lines to mark important zones. These annotations help maintain a structured approach to chart reading and improve decision-making accuracy.
- Right-click on the chart to add price alerts.
- Use the drawing tools to sketch trendlines and resistance levels.
- Save custom templates for repeated analysis.
- Remove outdated annotations to avoid confusion.
Frequently Asked Questions
Q: Can I change the background color of the Bybit chart?Yes, Bybit allows users to switch between light and dark themes. You can find this option under the settings icon located at the top-right corner of the chart area.
Q: How do I save my chart configuration on Bybit?You can save your current chart setup by clicking the three-dot menu in the chart window and selecting “Save Template.” This enables you to quickly apply the same indicators and settings in future sessions.
Q: Is it possible to view multiple charts simultaneously on Bybit?Bybit does not support split-screen or multi-chart views within the same browser tab. However, you can open multiple tabs or windows to monitor different trading pairs at once.
Q: Does Bybit offer a mobile chart analysis feature?Yes, the Bybit mobile app supports basic chart analysis with customizable time frames, indicators, and drawing tools. While slightly limited compared to the desktop version, it still provides essential functionality for on-the-go traders.
Disclaimer:info@kdj.com
The information provided is not trading advice. kdj.com does not assume any responsibility for any investments made based on the information provided in this article. Cryptocurrencies are highly volatile and it is highly recommended that you invest with caution after thorough research!
If you believe that the content used on this website infringes your copyright, please contact us immediately (info@kdj.com) and we will delete it promptly.


- Bitcoin, eCash Fork, and Airdrop Dynamics: A Deep Dive into Crypto's Latest Controversies
- 2026-05-03 12:55:01
- Consensus 2026 Miami: Web3, Blockchain, Cryptocurrency, NFTs, Metaverse, Conference, May 5th — Where Wall Street Meets the Digital Frontier
- 2026-05-02 12:45:01
- Fed Holds Rates Steady, Triggering Bitcoin Price Drop Amidst Geopolitical Tensions
- 2026-05-01 06:45:01
- Bitcoin Miners Electrify the Grid: Ohio Gas Plant Acquisition Powers Up a New Era for Digital Gold
- 2026-05-01 00:45:01
- MegaETH's MEGA Token Hits the Big Apple: Setting New Performance Benchmarks for Real-Time Blockchain
- 2026-05-01 00:55:01
- Solana's Slippery Slope: Price Prediction Points to Resistance Loss and Potential Further Drops
- 2026-05-01 06:45:01
Related knowledge

What Is Proof of Reserves? How Binance Demonstrates Asset Transparency
Jun 17,2026 at 09:39am
What Is Proof of Reserves?1. Proof of Reserves (PoR) is a cryptographic verification mechanism designed to confirm that a centralized cryptocurrency e...

How to Track Crypto Transactions for Tax Compliance
Jun 14,2026 at 01:48am
Global Regulatory Frameworks Impacting Transaction Tracking1. The Crypto-Asset Reporting Framework (CARF) mandates that all service providers facilita...

How to Manage Crypto Assets Across Multiple Binance Products
Jun 14,2026 at 05:03pm
Asset Allocation Across Binance Ecosystem1. Users maintain a unified account across Binance Spot, Futures, Margin, and Earn products using a single lo...

How to Redeem Assets from Binance Earn Without Confusion
Jun 14,2026 at 05:20am
Market Volatility Patterns1. Price swings exceeding 15% within a 24-hour window occur regularly across major cryptocurrencies including Bitcoin and Et...

How to Use Binance Earn Flexible Products for Passive Income
Jun 17,2026 at 01:39am
Understanding Flexible Products on Binance Earn1. Flexible products allow users to deposit and withdraw funds at any time without lock-up periods. 2. ...

What Is Binance Auto-Invest? A Beginner’s Guide to Automated Investing
Jun 14,2026 at 01:40pm
What Is Binance Auto-Invest?1. Binance Auto-Invest is a recurring purchase tool that allows users to buy cryptocurrencies at fixed intervals using fia...
What Is Proof of Reserves? How Binance Demonstrates Asset Transparency
Jun 17,2026 at 09:39am
What Is Proof of Reserves?1. Proof of Reserves (PoR) is a cryptographic verification mechanism designed to confirm that a centralized cryptocurrency e...
How to Track Crypto Transactions for Tax Compliance
Jun 14,2026 at 01:48am
Global Regulatory Frameworks Impacting Transaction Tracking1. The Crypto-Asset Reporting Framework (CARF) mandates that all service providers facilita...
How to Manage Crypto Assets Across Multiple Binance Products
Jun 14,2026 at 05:03pm
Asset Allocation Across Binance Ecosystem1. Users maintain a unified account across Binance Spot, Futures, Margin, and Earn products using a single lo...
How to Redeem Assets from Binance Earn Without Confusion
Jun 14,2026 at 05:20am
Market Volatility Patterns1. Price swings exceeding 15% within a 24-hour window occur regularly across major cryptocurrencies including Bitcoin and Et...
How to Use Binance Earn Flexible Products for Passive Income
Jun 17,2026 at 01:39am
Understanding Flexible Products on Binance Earn1. Flexible products allow users to deposit and withdraw funds at any time without lock-up periods. 2. ...
What Is Binance Auto-Invest? A Beginner’s Guide to Automated Investing
Jun 14,2026 at 01:40pm
What Is Binance Auto-Invest?1. Binance Auto-Invest is a recurring purchase tool that allows users to buy cryptocurrencies at fixed intervals using fia...
See all articles


