


![[Updated Season 2] Watched Season 2 in one go 🔥 Travel back to the desperate frontier scene where death row prisoners were exiled to the army in ancient times, and reversely select the ugly wife that no one in the audience dared to want | MULTI SUB](/uploads/2026/07/01/cryptocurrencies-news/videos/origin_6a449a7d1b0a6_image_500_375.webp "[Updated Season 2] Watched Season 2 in one go 🔥 Travel back to the desperate frontier scene where death row prisoners were exiled to the army in ancient times, and reversely select the ugly wife that no one in the audience dared to want | MULTI SUB")


-
 bitcoin
 $87959.907984 USD
1.34% - ethereum
$2920.497338 USD
3.04% - tether
$0.999775 USD
0.00% - xrp
$2.237324 USD
8.12% - bnb
$860.243768 USD
0.90% - solana
$138.089498 USD
5.43% - usd-coin
$0.999807 USD
0.01% - tron
$0.272801 USD
-1.53% - dogecoin
$0.150904 USD
2.96% - cardano
$0.421635 USD
1.97% - hyperliquid
$32.152445 USD
2.23% - bitcoin-cash
$533.301069 USD
-1.94% - chainlink
$12.953417 USD
2.68% - unus-sed-leo
$9.535951 USD
0.73% - zcash
$521.483386 USD
-2.87%


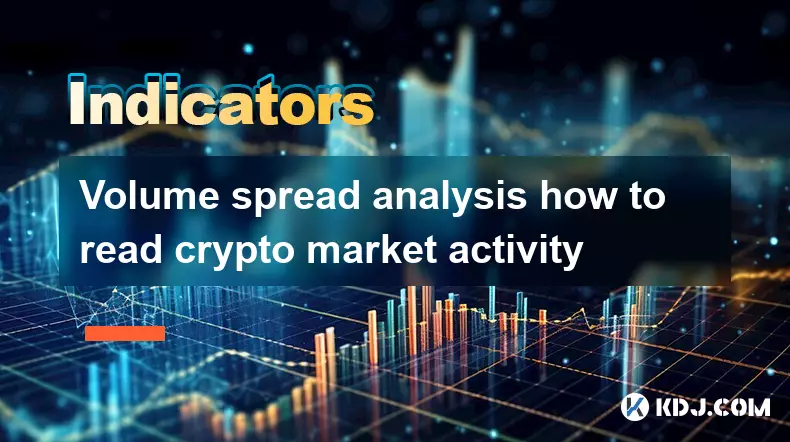
Volume spread analysis how to read crypto market activity
Volume Spread Analysis (VSA) decodes crypto market intent by fusing candle spread, volume, and close position—revealing institutional footprints amid noise.
Jul 01, 2026 at 01:40 pm
Understanding Volume Spread Analysis Fundamentals
1. Volume Spread Analysis (VSA) is a price-action methodology rooted in the study of supply and demand imbalances, adapted from classic Wyckoff principles to cryptocurrency markets.
2. It interprets the relationship between candlestick range (spread), trading volume, and closing price position to detect institutional participation and hidden market intent.
3. Unlike traditional indicators, VSA avoids lag by focusing exclusively on raw transaction data—price movement and volume—without smoothing or averaging.
4. In crypto contexts, VSA applies directly to BTC/USDT, ETH/USDT, and major altcoin pairs traded on both centralized and decentralized exchanges with sufficient liquidity.
5. A key premise holds that large players manipulate price and volume deliberately; their footprints appear as anomalies in spread-to-volume ratios across timeframes.
Identifying Key VSA Signals in Crypto Charts
1. Upthrusts occur when price pushes sharply higher on low volume and closes near the low of the candle—signaling weak buying conviction and potential reversal.
2. Spring patterns emerge after prolonged downtrends: price dips below prior support on shrinking volume, then rebounds strongly—indicating absorption by informed buyers.
3. No-demand bars show narrow spreads and minimal volume during rallies, revealing absence of aggressive buying despite upward movement.
4. Stop-run candles feature exaggerated wicks extending beyond recent structure, often coinciding with liquidation cluster zones identified via on-chain funding rate spikes.
5. Effort vs. result divergence appears when volume surges but price fails to break resistance—highlighting distribution or trapped long positions.
Applying VSA Across Exchange Environments
1. On Binance and OKX, VSA interpretation must account for order book depth distortions caused by high-frequency maker-taker rebates and quote stuffing tactics.
2. DEX-based VSA requires scrutiny of on-chain settlement timestamps—not just exchange-reported volume—to filter out wash-trading artifacts.
3. Spot versus perpetual futures volume ratios serve as confirmation filters: sustained spot volume dominance suggests organic accumulation, while perpetual skew signals leveraged speculation.
4. Stablecoin-denominated volume spikes correlate strongly with inflows from off-chain entities; USDT and USDC volume surges often precede major directional moves.
5. Cross-exchange VSA comparison reveals arbitrage latency windows—discrepancies in spread/volume alignment between Coinbase and Bybit may expose custody delays or custody-related slippage.
Integrating On-Chain Data with VSA
1. Whale wallet inflows into centralized exchanges, tracked via Santiment or Nansen, gain significance when aligned with high-volume upthrust candles—confirming distribution events.
2. Net unrealized profit/loss (NUPL) thresholds intersect with VSA patterns: spring formations near NUPL -0.25 often coincide with miner capitulation and institutional entry.
3. Exchange net deposit flows synchronized with no-supply bars indicate accumulation under consolidation—especially visible during BTC halving cycles.
4. Active address growth lagging price rallies validates effort-vs-result divergence, reinforcing VSA’s warning of unsustainable momentum.
5. Miner outflows spiking alongside stop-run candles suggest coordinated liquidation targeting, particularly evident in ETH staking withdrawal queues during volatile periods.
Frequently Asked Questions
Q1: Can VSA be applied to low-cap altcoins with fragmented liquidity?Yes—but only after verifying at least 72 hours of consistent order book depth above $5M and confirming volume authenticity through blockchain-level transaction count cross-checks.
Q2: How does leverage affect VSA signal reliability on perpetual futures charts?Leverage amplifies false breakouts; VSA requires filtering using funding rate extremes—signals gain validity only when funding exceeds ±0.1% for three consecutive hours.
Q3: Is volume normalization necessary when comparing BTC and meme coin charts?Normalization is essential; raw volume must be divided by 30-day average volume to generate relative volume (RVOL) before applying spread analysis.
Q4: Do VSA patterns behave differently during ETF-driven market phases?Yes—during SEC-approved Bitcoin ETF inflow periods, springs and upthrusts compress horizontally due to institutional flow prioritization over retail-driven volatility.
Disclaimer:info@kdj.com
The information provided is not trading advice. kdj.com does not assume any responsibility for any investments made based on the information provided in this article. Cryptocurrencies are highly volatile and it is highly recommended that you invest with caution after thorough research!
If you believe that the content used on this website infringes your copyright, please contact us immediately (info@kdj.com) and we will delete it promptly.


- Bitcoin, eCash Fork, and Airdrop Dynamics: A Deep Dive into Crypto's Latest Controversies
- 2026-05-03 12:55:01
- Consensus 2026 Miami: Web3, Blockchain, Cryptocurrency, NFTs, Metaverse, Conference, May 5th — Where Wall Street Meets the Digital Frontier
- 2026-05-02 12:45:01
- Fed Holds Rates Steady, Triggering Bitcoin Price Drop Amidst Geopolitical Tensions
- 2026-05-01 06:45:01
- Bitcoin Miners Electrify the Grid: Ohio Gas Plant Acquisition Powers Up a New Era for Digital Gold
- 2026-05-01 00:45:01
- MegaETH's MEGA Token Hits the Big Apple: Setting New Performance Benchmarks for Real-Time Blockchain
- 2026-05-01 00:55:01
- Solana's Slippery Slope: Price Prediction Points to Resistance Loss and Potential Further Drops
- 2026-05-01 06:45:01
Related knowledge

How does RSI overextension signal potential crypto correction?
Jun 29,2026 at 04:39pm
RSI Overextension Mechanics in Crypto Markets1. RSI values above 70 indicate overbought conditions where buying pressure has exhausted itself across m...

What is stochastic RSI crossover strategy in crypto trading?
Jun 29,2026 at 02:00pm
Stochastic RSI Fundamentals in Cryptocurrency Markets1. Stochastic RSI is derived from the standard RSI but applies stochastic oscillator logic to its...

What does OBV spike reveal about crypto whale activity?
Jun 30,2026 at 01:19am
On-Balance Volume and Whale Accumulation Patterns1. A sharp OBV spike coincides with unusually large inflows into exchange wallets, often preceding su...

How does ATR spike indicate panic selling in crypto markets?
Jun 28,2026 at 03:39pm
ATR Spike as a Real-Time Panic Signal1. The Average True Range (ATR) measures volatility by calculating the average of true ranges over a defined peri...

How does SMA act as psychological level in crypto markets?
Jun 28,2026 at 06:19pm
Psychological Anchoring in Market Sentiment1. Social Media Addiction (SMA) manifests in crypto markets through persistent attention fixation on price ...

What is VWAP reversal strategy in crypto scalping?
Jun 29,2026 at 07:19am
Market Volatility Patterns1. Bitcoin price swings often exceed 10% within a 24-hour window during high-liquidity events such as halving announcements ...
How does RSI overextension signal potential crypto correction?
Jun 29,2026 at 04:39pm
RSI Overextension Mechanics in Crypto Markets1. RSI values above 70 indicate overbought conditions where buying pressure has exhausted itself across m...
What is stochastic RSI crossover strategy in crypto trading?
Jun 29,2026 at 02:00pm
Stochastic RSI Fundamentals in Cryptocurrency Markets1. Stochastic RSI is derived from the standard RSI but applies stochastic oscillator logic to its...
What does OBV spike reveal about crypto whale activity?
Jun 30,2026 at 01:19am
On-Balance Volume and Whale Accumulation Patterns1. A sharp OBV spike coincides with unusually large inflows into exchange wallets, often preceding su...
How does ATR spike indicate panic selling in crypto markets?
Jun 28,2026 at 03:39pm
ATR Spike as a Real-Time Panic Signal1. The Average True Range (ATR) measures volatility by calculating the average of true ranges over a defined peri...
How does SMA act as psychological level in crypto markets?
Jun 28,2026 at 06:19pm
Psychological Anchoring in Market Sentiment1. Social Media Addiction (SMA) manifests in crypto markets through persistent attention fixation on price ...
What is VWAP reversal strategy in crypto scalping?
Jun 29,2026 at 07:19am
Market Volatility Patterns1. Bitcoin price swings often exceed 10% within a 24-hour window during high-liquidity events such as halving announcements ...
See all articles


