 |
|
 |
|
 |
|
 |
|
 |
|
 |
|
 |
|
 |
|
 |
|
 |
|
 |
|
 |
|
 |
|
 |
|
 |
|
加密货币新闻
Solana (SOL) Shows Promising Technical Patterns as Bitcoin Price Action Signals Potential Breakout
2025/04/29 17:08
Solana's price action is showing signs of a potential breakthrough as it pivots at a critical technical level.
What Happened: Veteran trader Josh Olszewicz noted that the SOL/BTC pair has been forming an inverse-head-and-shoulders pattern since early March. The pattern consists of a March 19 low at 0.00127 BTC (around $120), forming the head and is flanked by higher swing lows, which make up the shoulders. The horizontal neckline is at approximately 0.00162 BTC.
With Bitcoin trading at $94,765, Solana is currently priced around $150 per coin.
This pattern is taking shape just two months after the market completed the opposite formation. From mid-December to early February, SOL/BTC carved out a standard head-and-shoulders pattern, which led to the February decline.
The symmetry between these patterns adds credibility to the current formation. It showcases how consistently the pair has followed classical chart patterns over the past six months.
Related Link: How To Trade The Inverse Head And Shoulders Pattern
Technical Analysis: Olszewicz's chart analysis includes an Ichimoku overlay with specific technical levels. The Tenkan-sen sits at 0.00150 BTC, while the Kijun-sen is at the neckline (0.00162 BTC).
The Senkou Span A prints at 0.001742 BTC, and Span B holds higher at 0.002159 BTC. The cloud remains bearish but is beginning to compress, which signals weakening downward momentum.
"E2E [edge to edge] at some point but not soon, prob late May when the Kumo thins materially," the trader stated.
A premature breakout attempt could see rejection back to around 0.00151 BTC ($143). This level also coincides with the current Tenkan-sen position.
The Chikou Span remains below price and cloud, indicating that trend confirmation is still pending. Both Ichimoku followers and pattern traders would agree that 0.00162 BTC is the key level Solana bulls need to break.
If SOL manages to reach the edge-to-edge target, it would gain approximately 26% against Bitcoin from current levels. This would bring it back to early February prices, around $205.
On the other hand, if the neckline rejects again, support is minimal until around 0.00145–0.00148 BTC. Breaking below this level would invalidate the bullish outlook.
See More: Best Cryptocurrency Scanners
免责声明:info@kdj.com
所提供的信息并非交易建议。根据本文提供的信息进行的任何投资,kdj.com不承担任何责任。加密货币具有高波动性,强烈建议您深入研究后,谨慎投资!
如您认为本网站上使用的内容侵犯了您的版权,请立即联系我们(info@kdj.com),我们将及时删除。
-

-

- XRP在Banksocial的扩展策略中引起了人们的关注
- 2025-05-26 06:45:12
- 由Banksocial的首席执行官,Hedera生态系统中的主要开发人员John Wingate撰写
-

-

-

- XRP失去了比特币的支持
- 2025-05-26 06:35:13
- 在价格持续增长之后,XRP最近在看涨势头下的势头放缓。从强大的投资者兴趣中受益的Altcoin已开始失去一些上升势头。
-

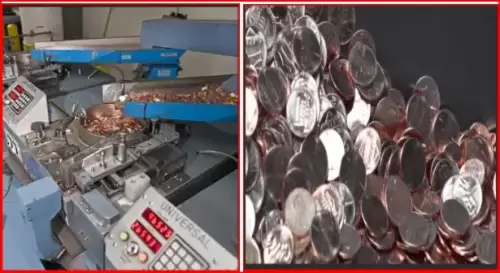
- 美国一分钱生产的时代正在慢慢结束
- 2025-05-26 06:35:13
- 美国财政部于5月22日宣布,它将在生产超过两个世纪后开始淘汰便士的铸造。
-

-

- Cryptopunks占据了NFT销售的主导
- 2025-05-26 06:30:12
- CryptoSlam报告的新数据显示,过去一周中,更广泛的NFT市场销售量价值1.3045亿美元,增长了2.61%
-


