 |
|
 |
|
 |
|
 |
|
 |
|
 |
|
 |
|
 |
|
 |
|
 |
|
 |
|
 |
|
 |
|
 |
|
 |
|
在过去的几天中,FET恢复了看涨的市场结构。但是,它已经从事长期看跌趋势,因此投资者可能希望在购买之前等待一点。

If you're interested in taking a closer look at the technical analysis of FET and its potential for further gains, here is a breakdown of the analysis presented.
如果您有兴趣仔细研究FET的技术分析及其进一步收益的潜力,那么这是对分析的细分。
The analysis highlights several key factors that suggest FET could be heating up again after a period of sideways trading.
该分析强调了一些关键因素,表明FET经过一段时间的交易,可能会再次加热。
Here are some of the notable points:
这是一些值得注意的观点:
1. Surpassing $0.566 for Long Positions
1。长位置超过$ 0.566
- The analysis suggests opening long positions as the price is now above the $0.566 level, which formed the most recent high.
- 分析表明,由于价格现在高于$ 0.566的水平,这是最近的高位。
- It seems that FET is breaking its downtrend line and will be able to bounce back after a retest, which occurred on April 18.
- 似乎FET打破了其下降趋势线,并在4月18日发生的重新测试后能够反弹。
2. Key Resistance Levels to Watch
2。关键阻力水平要观看
- In the immediate term, the next significant high to clear on the way up was around $0.75, which was the next price target.
- 在不久的学期,下一个重要的高点在上升范围内,大约是0.75美元,这是下一个目标目标。
- Above that, there were several key horizontal resistance levels to watch at $0.83 and $1.10.
- 在此之上,有几个关键的水平阻力水平值为0.83美元和1.10美元。
- The $1.10 and $1.25 levels were particularly important as they were hit several times in 2024, and they were highlighted in red.
- $ 1.10和1.25美元的水平尤为重要,因为它们在2024年被击中多次,并以红色突出显示。
3. DMI Indicator Shows Trend Shift
3。DMI指标显示趋势变化
- The DMI indicator had interesting implications. It showed that the bearish trend had been replaced by a bullish trend.
- DMI指标具有有趣的含义。这表明看跌趋势已被看涨的趋势所取代。
- The ADX (yellow) and +DI (green) were both above 20, which indicated a strong bullish trend in progress.
- ADX(黄色)和 +DI(绿色)都高于20,这表明正在进行的前线趋势。
4. CMF Shows Capital Flows and Chart Position
4。CMF显示资本流和图表位置
- The CMF was at +0.04. A move above +0.05 would signal significant capital inflows and increased buying pressure.
-CMF为+0.04。超过+0.05的移动将表明大量资本流入和增加的购买压力。
- Additionally, this CMF was at weekly lows. The last time it was at these levels was in August last year, before its 220% rebound.
- 此外,此CMF每周低点。上一次达到这些水平是去年八月,在其220%的反弹之前。
5. MACD Approaching Crossover Signal
5。MACD接近交叉信号
- The MACD was about to make a bullish signal line crossover, which would be another sign of buyer dominance.
- MACD即将进行看涨的信号线跨界,这将是买方统治的另一个迹象。
6. Overall Technical Outlook
6。整体技术前景
- Overall, it appeared likely that the Artificial Superintelligence Alliance token would continue to rise.
- 总体而言,人工超级智能联盟代币似乎可能会继续上升。
7. Recent Bearish Phase and Chart View
7。最近的看跌阶段和图表视图
- Despite a recent bearish phase, technical indicators suggested that FET had a good chance to continue its upward momentum.
- 尽管最近发生了看跌阶段,但技术指标表明FET有很好的机会继续其上升势头。
8. Long and Short Positions
8。长位置和短位置
- The balance between long and short positions also indicated that the market was ready for a bullish trend. If buyers could maintain the pressure, FET could reach its target of $0.75 in the coming weeks.
- 长位置和短职位之间的平衡还表明,市场已准备好看涨趋势。如果买家可以维持压力,FET可以在未来几周内达到0.75美元的目标。
Those interested in buying the token can do so on Weex.
那些有兴趣购买令牌的人可以在Weex上这样做。
免责声明:info@kdj.com
所提供的信息并非交易建议。根据本文提供的信息进行的任何投资,kdj.com不承担任何责任。加密货币具有高波动性,强烈建议您深入研究后,谨慎投资!
如您认为本网站上使用的内容侵犯了您的版权,请立即联系我们(info@kdj.com),我们将及时删除。
-

- 雪崩(Avax)宣布了1亿美元的融合计划
- 2025-05-22 11:35:13
- Ruvi AI通过将AI的力量与区块链的安全性和透明度相结合而脱颖而出。它专注于提供优化工作流的工具
-

-

-

- 特朗普模因硬币在《天才法案》中的进展中发布了很大的收益
- 2025-05-22 11:30:13
- 当特朗普模因硬币发布了巨大收益时,加密货币市场见证了另一个值得注意的发展
-

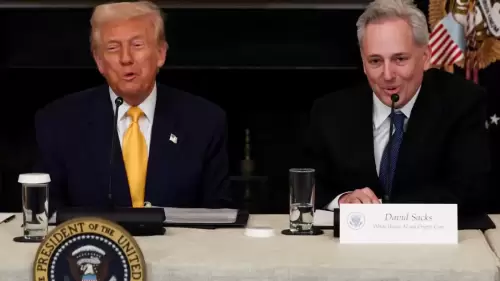
- 唐纳德·特朗普总统的顶级加密货币和AI顾问戴维·萨克斯周三表示,政府预计斯塔布尔肯立法通过参议院进行
- 2025-05-22 11:25:13
- 三位分析师说,这款自动驾驶汽车技术库存可能会超过400%。
-

-

-

-

- TRON(TRX)继续领导区块链技术,以其分散的AI-Power SuperApp开创了新的边界
- 2025-05-22 11:15:13
- Ruvi AI以其独特的区块链透明度和人工智能突破而引起了市场的关注。


