 |
|
 |
|
 |
|
 |
|
 |
|
 |
|
 |
|
 |
|
 |
|
 |
|
 |
|
 |
|
 |
|
 |
|
 |
|
当交易者观看可能点燃短期集会的关键水平时,近乎协议开始转动。来自AltCryptoGems的加密分析师Sjuul在X上共享,即接近价格正在接近图表上的一个位置,其中两个主要的阻力线相遇

Near Protocol (NEAR) price is heating up as traders watch a key level that could trigger a short-term rally.
几乎协议(接近)价格正在加热,因为交易者观看了可能触发短期集会的关键水平。
As the cryptocurrency market continues to show signs of recovery, several altcoins have come into the spotlight. Among them is Near Protocol (NEAR), which is now approaching a crucial price zone where two major resistance lines converge.
随着加密货币市场继续显示出恢复的迹象,几个山寨币引起了人们的关注。其中包括近协议(接近),该协议现在正在接近一个至关重要的价格区域,其中两个主要的阻力线融合了。
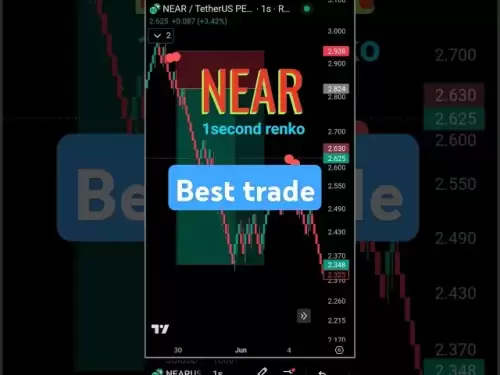
Crypto analyst Sjuul from AltCryptoGems shared on X (formerly Twitter) that NEAR price is nearing the intersection of a horizontal resistance level and a descending trendline. This confluence of resistance at $2.35–$2.40 makes it a pivotal area for both buyers and sellers.
来自AltCryptogems的加密分析师Sjuul在X(以前是Twitter)上分享了接近价格的近距离,即将接近水平阻力水平和下降趋势线的交集。这种电阻的汇合处为$ 2.35- $ 2.40,使其成为买卖双方的关键区域。
The lower FIB level, which serves as a multiple point of support, is placed at $2.35, while the trendline provides an additional layer of resistance around $2.40. The buildup of resistance at this zone is significant, and a break above it could have broader implications for the NEAR trend.
较低的FIB水平作为多个支持点,定为2.35美元,而Trendline则提供了额外的阻力层,约为2.40美元。在该区域的阻力积累很大,超出其突破可能对近趋势具有更大的影响。
What might unfold next depends on whether the buyers manage to defend the price above the neckline support, which is also the same as the diagonal trendline, both around $2.35–$2.40, or if the sellers return to push the price lower.
接下来可能会发生的可能性取决于买家是否设法捍卫了领口支持的价格,这与对角线趋势线也相同,均约为2.35-2.40美元,还是卖家是否返回以降低价格。
If NEAR price can hold above this support, it would suggest that the downtrend is over and a new upward move has begun. This move could be fueled by the recent double bottom pattern that formed on the 12H chart.
如果几乎价格能超过此支持,则表明下降趋势已经过去,并且开始了新的向上移动。在12h图表上形成的最近的双底模式可以推动这一举动。
The double bottom pattern is a bullish technical indicator that occurs when the price of a security makes two lows at roughly the same level, followed by a rally. It is often seen as a signal that a trend might be about to reverse.
双底模式是一个看涨的技术指标,当安全性的价格在大致相同的水平上,然后进行集会时,就会发生。通常将其视为趋势可能会逆转的信号。
In the case of NEAR, the double bottom pattern formed around the $2.00 zone. After bouncing off that level twice, the Near Protocol price pushed toward the neckline between $2.35 and $2.40.
在近距离的情况下,双底模式在$ 2.00区域附近形成。在两次弹跳该水平后,近协议价格将领口推向2.35美元至2.40美元之间。
After testing the neckline, NEAR broke slightly above it, which also acted as support. This move could be a classic bullish confirmation, one that traders often look for before a bigger move kicks in.
测试领口后,附近略高于其上方,这也充当了支撑。这一举动可能是经典的看涨确认,在更大的举动开始之前,交易者经常寻找。
After breaking the neckline, NEAR also managed to break the descending trendline from earlier highs, which is now crossed through the same price zone. This overlap makes $2.35–$2.40 a big deal for both sides of the market.
打破领口后,附近还设法从早期的高点中打破了下降的趋势线,该趋势现在已经穿过相同的价格区。这种重叠的价格为2.35– $ 2.40,对于市场的两面来说都是一件大事。
If the buyers can manage to defend the price above this support, it would suggest that the downtrend is over and a new upward move has already begun.
如果买家可以设法捍卫高于此支持的价格,则表明下降趋势已经过去,并且已经开始了新的向上移动。
Near Protocol Price Levels To Watch Moving Forward
接近协议价格水平,要关注前进
With the neckline and trendline both broken, the next resistance level is seen between $2.80 and $3.00. This area corresponds to the previous high before the recent decline.
随着领口和趋势线都破裂,下一个阻力水平在2.80美元至3.00美元之间。该区域对应于最近下降之前先前的高点。
If momentum builds and the price holds above $2.40, traders could view the next leg upward as a continuation of the double bottom breakout.
如果动量建设并且价格上涨了2.40美元,交易者可以将下一条回合视为双重底部突破的延续。
Support remains at $2.35–$2.40, which may act as a foundation for future bullish activity. If that support fails, the psychological level at $2.00 would be the next area to monitor. For now, the setup favors buyers, assuming volume remains steady.
支持仍为2.35-2.40美元,这可能是未来看涨活动的基础。如果支持失败,心理水平为$ 2.00,将是下一个要监视的领域。就目前而言,假设数量保持稳定,则设置有利于买家。
“Both H&S and fib suggest a move towards $1.60, but we never got close to that level as buyers stepped in around $2.00 to prevent further decline,” Sjuul added.
Sjuul补充说:“ H&S和FIB都建议朝1.60美元的转移,但是随着买家踏上约2.00美元以防止进一步下降,我们从来没有接近这个水平。”
Further attention was called to the ongoing setup in his tweet: "Lots of technical confluence as diagonal resistance meets horizontal resistance at the same time and same price zone."
在他的推文中,人们提出了进一步的关注:“随着对角线阻力在同一时间和相同的价格区域都符合水平阻力,许多技术融合。”
This combination of a double bottom, a resistance break, and a key support retest presents a structured setup. While market sentiment remains mixed across the broader space, technical conditions on NEAR price suggest that a larger move could be forming if current levels hold.
双重底部,电阻断裂和重新测试的这种组合呈现出结构化设置。尽管市场情绪在整个更广阔的空间中仍然混杂在一起,但近价格的技术条件表明,如果当前水平保持,则可能会形成更大的举动。
免责声明:info@kdj.com
所提供的信息并非交易建议。根据本文提供的信息进行的任何投资,kdj.com不承担任何责任。加密货币具有高波动性,强烈建议您深入研究后,谨慎投资!
如您认为本网站上使用的内容侵犯了您的版权,请立即联系我们(info@kdj.com),我们将及时删除。
-

-

- Neo Pepe的革命开始
- 2025-06-14 01:30:12
- 想象一个世界,模因和加密货币团结起来挑战财务规范。 Neo Pepe不仅是另一个模因硬币。这是一种叛乱
-

-

-

-

- 市值通常会使休闲投资者感到困惑,而批评者将其武器与看涨的XRP价格预测相反
- 2025-06-14 01:20:12
- 市值的概念通常会使休闲投资者感到困惑,而批评者将其与看涨的XRP价格预测相抵触。
-

-

-


