 |
|
 |
|
 |
|
 |
|
 |
|
 |
|
 |
|
 |
|
 |
|
 |
|
 |
|
 |
|
 |
|
 |
|
 |
|
BNB价格现在正好坐在50%的斐波那契水平上,这表明该区域可能是一个枢纽 - 超过的休息可能会重新点燃看涨的举动,但拒绝可能会向BNB重新测试支持,接近620美元。

Binance Coin (BNB) price has been pinging the $640 level for several sessions, but the recent price action shows signs of fatigue. Is BNB losing momentum after a sharp rally, or is it just setting up for a critical decision point? Let's look at the latest TradingView hourly and daily charts.
Binance Coin(BNB)的价格一直在几次会议上筹集640美元的水平,但最近的价格动作显示了疲劳的迹象。 BNB是在急剧集会后失去动力,还是只是为关键决策点设置?让我们看一下每小时和每日图表的最新交易。
At the time of writing, BNB/USD is still within a very narrow range at $640.2, adding a minimal 0.02% as the last candle closed. The price is testing the 200-hour SMA at $642.6 and the 50-hour SMA at $642.9. Both are nearly flat, indicating indecision in the short term.
在撰写本文时,BNB/USD仍在非常狭窄的范围内,为640.2美元,随着最后一支蜡烛的关闭,最少的0.02%。价格将200小时的SMA售价为642.6美元,而50小时的SMA为642.9美元。两者几乎都是平坦的,在短期内表示犹豫不决。
Also, traders can notice a bearish crossover, where shorter hourly moving averages failed to climb above the longer ones, typically signaling selling pressure. The Heikin Ashi candles are showing small-bodied formations with wicks on both ends, further reinforcing the narrative of a sideways chop and lack of trend.
此外,交易者可以注意到一个看跌的跨界车,每小时较短的移动平均值未能攀升到较长的跨界,通常表示销售压力。 Heikin Ashi蜡烛在两端都显示出小型形成,进一步加强了侧向砍伐的叙事和缺乏趋势。
Using a Fibonacci retracement from the recent hourly high of $660 to the low near $620, we can estimate:
我们可以估计,使用最近的660美元到660美元的斐波那契回撤,我们可以估计:
This places BNB price at the 50% Fibonacci level, suggesting this zone could act as a pivot — a break above could re-ignite a bullish move from the fib lows, but rejection may send BNB retesting the 0 fib and key hourly support.
这将BNB价格定为50%的斐波那契水平,这表明该区域可能是一个枢轴 - 超过的突破可能会从FIB低点重新点燃看涨的移动,但是拒绝可能会向BNB重新测试0 FIB和关键的小时支持。
What Does The Daily Chart Say About The Bigger Picture?
每日图表对大局有何评论?
Zooming out, the daily chart paints a more optimistic picture, but it’s not without red flags. BNB price is still trading above all key daily moving averages:
缩小,每日图表描绘了更乐观的图片,但并非没有危险信号。 BNB价格仍然超过所有关键的日常移动平均值:
This alignment of the short-term SMA > long-term SMA is a classic bullish structure. However, the price action is stalling near $645-$650 — an area that coincides with the 0.382 Fibonacci retracement from the March high to the April low.
短期SMA>长期SMA的对齐方式是经典的看涨结构。但是,价格行动的停滞量接近645-650美元,该区域与从3月高到4月至4月低点的0.382斐波那契回购相吻合。
The local top of $660 formed earlier this week has yet to be breached, and the last few candles are showing signs of weakening momentum with lower highs and smaller bodies. If this is a bull flag pattern, which it appears to be, we can estimate the breakout target using flagpole projection:
本周早些时候成立的660美元的本地顶级尚未被破坏,最后几支蜡烛显示出弱点和较小的身体弱势势头的迹象。如果这是牛市标志模式,它似乎是,我们可以使用旗杆投影估算突破目标:
This gives a bullish breakout target of $720, but only if Binance Coin price can decisively close above $660 with strong volume.
这给出了720美元的看涨突破目标,但前提是二金硬币价格可以果断地超过660美元,量强劲。
Can BNB Price Reclaim $700 After Losing $650?
BNB Price在损失650美元后可以收回$ 700吗?
To answer this, let’s combine momentum and price structure:
要回答这个问题,让我们结合势头和价格结构:
So, if $640 fails, the next daily support lies at $620, and below that, the 100-day SMA near $613. On the flip side, a move above $660 would open up room for $700 and then $720, based on the flagpole calculation.
因此,如果$ 640失败,下一个每日支持为620美元,低于此的SMA近613美元。另一方面,根据旗杆计算,以700美元的价格开放了660美元的移动,然后以700美元的价格开放空间。
Final Thoughts: What's The Trade?
最终想法:交易是什么?
BNB price sideways action is a cool-off phase after a strong May rally. Right now, it’s a battle between short-term bearish traders and long-term bullish trend continuation. The market is waiting for a trigger — likely Bitcoin’s next move or macro news — to decide the direction.
BNB价格侧向行动是强大的竞选之后的一个冷静阶段。目前,这是短期看跌商人与长期看涨趋势延续之间的战斗。市场正在等待触发器(可能是比特币的下一步或宏观新闻)来决定方向。
For technical traders, $660 is the breakout level to watch, and $620 is the key support. The next 48 hours will be critical in determining if BNB heads toward $700 or dips back to $600.
对于技术交易者来说,660美元是要观看的突破水平,而620美元是主要支持。接下来的48小时对于确定BNB是否达到700美元或降至600美元至关重要。
免责声明:info@kdj.com
所提供的信息并非交易建议。根据本文提供的信息进行的任何投资,kdj.com不承担任何责任。加密货币具有高波动性,强烈建议您深入研究后,谨慎投资!
如您认为本网站上使用的内容侵犯了您的版权,请立即联系我们(info@kdj.com),我们将及时删除。
-

- Cardano基金会正在准备发布有关其财政部持有的审计报告
- 2025-05-20 00:05:14
- 在新的指控浮出水面之后,声称盗用了约6亿美元的ADA代币。
-

- Solaxy(Solx)正在通过加密verse
- 2025-05-20 00:05:14
- 在过去的两周中,购买的令人印象深刻的收购激增凸显了投资者的信心,因为这种预售接近它。
-

- 在加密热潮中,少数模因硬币引起了人们的注意
- 2025-05-20 00:01:11
- 在加密蛋白激增的过程中,少数模因硬币引起人们的注意。
-

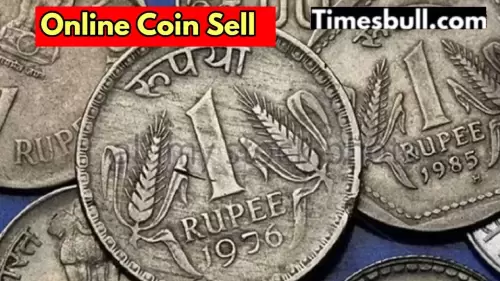
- 震惊!人们现在通过出售旧的1卢比硬币来赚取数十万卢比
- 2025-05-20 00:01:11
- 您会惊讶的是,人们现在通过出售硬币和笔记赚了很多钱,这是一个很好的机会。如果您的小猪银行有一枚旧的1卢比硬币
-

- BYBIT通过提供美国顶级股票的直接交易来扩展到传统市场
- 2025-05-19 23:55:13
- Bybit宣布将与Stablecoin Tether提供直接交易全球顶级股票
-

-

-

-

- 加拿大最好的加密赌场 - 以太坊(ETH)无KYC赌场评论
- 2025-05-19 23:45:14
- 在加拿大,越来越多的在线赌场玩家正在离开传统赌博平台,转向加密赌场


