


-
 bitcoin
 $87959.907984 USD
1.34% - ethereum
$2920.497338 USD
3.04% - tether
$0.999775 USD
0.00% - xrp
$2.237324 USD
8.12% - bnb
$860.243768 USD
0.90% - solana
$138.089498 USD
5.43% - usd-coin
$0.999807 USD
0.01% - tron
$0.272801 USD
-1.53% - dogecoin
$0.150904 USD
2.96% - cardano
$0.421635 USD
1.97% - hyperliquid
$32.152445 USD
2.23% - bitcoin-cash
$533.301069 USD
-1.94% - chainlink
$12.953417 USD
2.68% - unus-sed-leo
$9.535951 USD
0.73% - zcash
$521.483386 USD
-2.87%


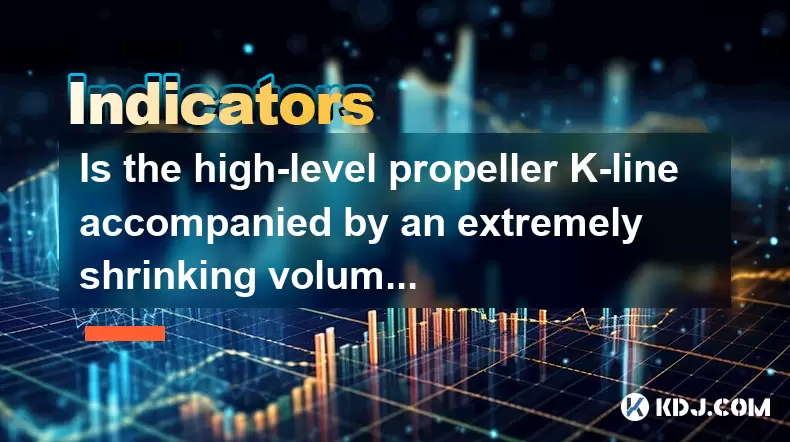
高级螺旋桨K-Line是否伴随着极大的量会改变市场?
A high-level propeller K-line with shrinking volume in crypto suggests market indecision and potential trend reversal, but should be confirmed with other indicators.
2025/06/29 18:15
高级螺旋桨K-Line是什么?
高级螺旋桨K-Line是在加密货币图表中经常观察到的烛台模式。它通常出现在市场犹豫期间,在这种时期,买卖双方都在积极地上下推动价格,从而产生了长长的上下阴影,并带有一个小的真实身体。当这种模式以相对较高的价格水平形成时,它被称为高级螺旋桨。
这种类型的K线表明,尽管有强大的波动性,但没有明显的方向性偏见。长阴影表明,价格较高和较低,但最终在开放价格上关闭。在加密货币交易的背景下,由于市场固有的波动性和投机性质,这种模式可能很重要。
音量在这种模式中如何发挥作用?
在解释任何烛台模式的重要性时,体积是关键因素。高级螺旋桨K-line伴随着极度缩小的数量,这意味着,即使价格行动显示出波动性,交易者也没有投入大量资金,而这两边的任何一方。
在传统的技术分析中,挥发性价格变动期间体积减少通常标志着弱势势头。这意味着,如果体积大幅下降,它可能表明,公牛和熊都没有强烈参与,可能会导致巩固阶段或逆转,具体取决于随后的蜡烛的表现。
这种模式可以标志着市场逆转吗?
交易者中最有争议的问题之一是,较低体积的高级螺旋桨K线是否可以作为可靠的逆转信号。在许多情况下,尤其是在成熟的市场中,螺旋桨蜡烛的阻力水平随着数量的下降而逆转。
但是,在受情绪和宏观经济因素影响很大的加密货币市场中,仅应将这种模式视为确定的逆转信号。交易者经常将其与其他工具相结合,例如移动平均值,RSI差异或斐波那契回溯水平,以确认潜在的趋势变化。
同样重要的是要注意,错误信号在加密货币市场中很常见。因此,仅依靠这种烛台模式而没有其他确认可能会导致过早交易。
交易者应该如何应对这种情况?
对于活跃的交易者而言,遇到具有急剧减少的高级螺旋桨K线应引发谨慎而不是立即采取行动。以下是交易者可能会考虑的一些步骤:
- 等待确认:查看螺旋桨之后的接下来几支蜡烛。如果它们显示出清晰的方向移动,体积增加,则可能标志着新趋势的开始。
- 使用支持/阻力水平:确定螺旋桨蜡烛周围的关键支撑和阻力区。批量增加或高于这些水平的中断可能会提供更好的贸易设置。
- 监视订单簿深度:在加密交易所中,分析订单书可以提供有关潜在支持或销售压力的见解,而这些压力是从图表中立即可见的。
- 设置严格的停止损失:如果基于这种模式进入职位,请使用严格的停止命令来管理加密货币市场的不可预测性质,以管理风险。
- 与其他指标结合使用:使用体积加权的移动平均值或MACD交叉来过滤错误信号并提高准确性。
这些步骤中的每一个都需要仔细观察和纪律,尤其是考虑到数字资产市场的快速发展性质。
来自加密货币图表的真实示例
查看来自Bitcoin(BTC)和以太坊(ETH)等主要加密货币的历史数据,我们可以找到几个实例,其中高级螺旋桨蜡烛随着收缩量出现。
例如,在2021年末,Bitcoin形成了一支螺旋桨蜡烛,价格近65,000美元,数量异常低。在接下来的几周中,价格开始下降,最终纠正了30%以上。同样,以太坊在2022年初显示出类似的模式,然后才进入一个长时间的看跌期。
这些示例强调,尽管螺旋桨k-line的体积较低并不能保证逆转,但它通常是不确定性或巩固之前的。观察到这样的蜡烛之后的几天市场的反应可以提供宝贵的线索。
常见问题(常见问题解答)
哪些时间范围最适合分析高级螺旋桨K-Line?
尽管高级螺旋桨K线可以在任何时间范围内出现,但它往往会在4小时或每日图表等较高的时间范围内承担更多的重量。这些时间范围反映了更广泛的市场情绪,并倾向于以15分钟或1小时的图表(如15分钟或1小时的图表)滤除噪声。
这种模式可以在强大的趋势阶段出现吗?
是的,即使在强烈的趋势中,螺旋桨K线也可以发生。但是,其意义有所不同。在健康的上升趋势中,具有适度体积的螺旋桨蜡烛可能表明暂时获利而不是逆转。但是,如果它的体积极低,它也可能暗示即使在趋势范围内,也可以暗示逐渐消失的动力。
在某些加密货币中,高级螺旋桨K-line是否更可靠?
没有结论性的证据表明该模式在特定的加密货币中的表现更好。但是,与较小的山寨币相比,由于其更深的流动性和更广泛的参与,诸如BTC和ETH之类的大型硬币倾向于具有更可预测的烛台行为,而较小的AltCoins可能会表现出不稳定的价格作用。
新闻如何影响这种模式的可靠性?
新闻事件(尤其是意外的事件)可能会使烛台模式无效。例如,如果在重大监管公告或宏观经济数据发布之前形成了高级螺旋桨K线,则随后的价格变动可能与典型的烛台逻辑不符。因此,交易者应始终在技术模式以及技术模式的同时评估更广泛的基本环境。
免责声明:info@kdj.com
所提供的信息并非交易建议。根据本文提供的信息进行的任何投资,kdj.com不承担任何责任。加密货币具有高波动性,强烈建议您深入研究后,谨慎投资!
如您认为本网站上使用的内容侵犯了您的版权,请立即联系我们(info@kdj.com),我们将及时删除。


- 比特币、eCash 分叉和空投动态:深入探讨加密货币的最新争议
- 2026-05-03 12:55:01
- 2026 年迈阿密共识:Web3、区块链、加密货币、NFT、Metaverse,会议,5 月 5 日 — 华尔街与数字前沿相遇的地方
- 2026-05-02 12:45:01
- 美联储维持利率稳定,地缘政治紧张局势引发比特币价格下跌
- 2026-05-01 06:45:01
- 比特币矿工为电网供电:收购俄亥俄州天然气厂开启数字黄金新时代
- 2026-05-01 00:45:01
- MegaETH的MEGA代币登陆纽约:为实时区块链设定新的性能基准
- 2026-05-01 00:55:01
- Solana 的滑坡:价格预测表明阻力损失和潜在的进一步下跌
- 2026-05-01 06:45:01
相关百科

RSI 过度延伸如何表明潜在的加密修正?
2026-06-29 16:39:45
加密市场中的 RSI 过度延伸机制1. RSI 值高于 70 表明出现超买状况,币安和 Bybit 等主要交易所的购买压力已耗尽。 2、当BTC的14周期RSI连续三个小时攀升至80以上时,历史链上数据显示未来48小时内价格反转的概率为68%。 3. 在高交易量上涨阶段,以太坊的 RSI 超过 75...

加密货币交易中的随机 RSI 交叉策略是什么?
2026-06-29 14:00:09
加密货币市场中的随机 RSI 基本面1. 随机 RSI 源自标准 RSI,但将随机振荡器逻辑应用于其值,将其转换为范围从 0 到 100 的有界振荡器。 2. 与测量固定回顾期内价格变化速度的原始 RSI 不同,随机 RSI 将当前 RSI 值与其近期高低范围(通常超过 14 个周期)进行比较,以识...

Ichimoku 云滞后跨度如何帮助加密分析?
2026-07-03 06:59:39
加密图表中的滞后跨度功能1. Chikou Span 绘制了当前收盘价向后移动 26 个周期的图,将价格走势锚定于历史背景。 2. 在 Bitcoin 或以太坊等波动性加密资产中,这种向后转变揭示了最近的价格水平是否受到先前盘整区域的支持。 3. 当 Chikou Span 突破之前的价格柱时,它确...

OBV 峰值揭示了加密鲸鱼活动的哪些信息?
2026-06-30 01:19:57
平衡交易量和鲸鱼积累模式1. OBV 急剧上升,与异常大量资金流入交易所钱包同时发生,通常发生在价格持续上涨之前。 2. 当 OBV 飙升而价格保持平稳或盘整时,这表明隐藏的积累——鲸鱼正在吸收供应,但不会立即引发上涨走势。 3. 从历史上看,持续的 OBV 背离——价格下跌期间 OBV 上升——出...

ATR 飙升如何表明加密货币市场出现恐慌性抛售?
2026-06-28 15:39:39
ATR 尖峰作为实时恐慌信号1. 平均真实波动幅度 (ATR) 通过计算指定时间段(通常为 14 天)内真实波动幅度的平均值来衡量波动性。 ATR 突然飙升反映了价格变动幅度的突然扩大——不是方向性偏差,而是原始的变化幅度。 2. 在恐慌性抛售期间,价格走势变得不稳定且不连续。缺口、影线和几分钟内快...

SMA 如何充当加密市场中的心理水平?
2026-06-28 18:19:56
市场情绪的心理锚定1. 社交媒体成瘾(SMA)通过对价格图表、推文和实时订单簿更新的持续关注在加密货币市场中表现出来。 2. 表现出 SMA 症状的交易者通常会以亚分钟的间隔刷新仪表板,从而引发与感知波动性而非实际风险敞口相关的皮质醇峰值。 3. 神经反馈回路强化了这种行为:每次向上滴答声都会释放多...
RSI 过度延伸如何表明潜在的加密修正?
2026-06-29 16:39:45
加密市场中的 RSI 过度延伸机制1. RSI 值高于 70 表明出现超买状况,币安和 Bybit 等主要交易所的购买压力已耗尽。 2、当BTC的14周期RSI连续三个小时攀升至80以上时,历史链上数据显示未来48小时内价格反转的概率为68%。 3. 在高交易量上涨阶段,以太坊的 RSI 超过 75...
加密货币交易中的随机 RSI 交叉策略是什么?
2026-06-29 14:00:09
加密货币市场中的随机 RSI 基本面1. 随机 RSI 源自标准 RSI,但将随机振荡器逻辑应用于其值,将其转换为范围从 0 到 100 的有界振荡器。 2. 与测量固定回顾期内价格变化速度的原始 RSI 不同,随机 RSI 将当前 RSI 值与其近期高低范围(通常超过 14 个周期)进行比较,以识...
Ichimoku 云滞后跨度如何帮助加密分析?
2026-07-03 06:59:39
加密图表中的滞后跨度功能1. Chikou Span 绘制了当前收盘价向后移动 26 个周期的图,将价格走势锚定于历史背景。 2. 在 Bitcoin 或以太坊等波动性加密资产中,这种向后转变揭示了最近的价格水平是否受到先前盘整区域的支持。 3. 当 Chikou Span 突破之前的价格柱时,它确...
OBV 峰值揭示了加密鲸鱼活动的哪些信息?
2026-06-30 01:19:57
平衡交易量和鲸鱼积累模式1. OBV 急剧上升,与异常大量资金流入交易所钱包同时发生,通常发生在价格持续上涨之前。 2. 当 OBV 飙升而价格保持平稳或盘整时,这表明隐藏的积累——鲸鱼正在吸收供应,但不会立即引发上涨走势。 3. 从历史上看,持续的 OBV 背离——价格下跌期间 OBV 上升——出...
ATR 飙升如何表明加密货币市场出现恐慌性抛售?
2026-06-28 15:39:39
ATR 尖峰作为实时恐慌信号1. 平均真实波动幅度 (ATR) 通过计算指定时间段(通常为 14 天)内真实波动幅度的平均值来衡量波动性。 ATR 突然飙升反映了价格变动幅度的突然扩大——不是方向性偏差,而是原始的变化幅度。 2. 在恐慌性抛售期间,价格走势变得不稳定且不连续。缺口、影线和几分钟内快...
SMA 如何充当加密市场中的心理水平?
2026-06-28 18:19:56
市场情绪的心理锚定1. 社交媒体成瘾(SMA)通过对价格图表、推文和实时订单簿更新的持续关注在加密货币市场中表现出来。 2. 表现出 SMA 症状的交易者通常会以亚分钟的间隔刷新仪表板,从而引发与感知波动性而非实际风险敞口相关的皮质醇峰值。 3. 神经反馈回路强化了这种行为:每次向上滴答声都会释放多...
查看所有文章


