Discover Cryptocurrencies With Potential
Discover cryptocurrencies with potential, let us become richer together and add a zero to the end of our assets.
| Name | Price Price by day (USD). | Change%(3m) Price change by selected time range. | Volume(24h) Aggregated daily volume, measured in USD from on-chain transactions where each transaction was greater than $100,000. | Market Cap The total value of all the circulating supply of a cryptocurrency. It’s calculated by multiplying the current market price by the total number of coins that are currently in circulation. | Circulating supply The amount of coins that are circulating in the market and are in public hands. It is analogous to the flowing shares in the stock market. | Ownership Distribution Shows the circulating supply distribution of a cryptocurrency. The three groups are classified such as: Whales: Addresses holding over 1% of a crypto-asset’s circulating supply. Investors:Addresses holding between 0.1% and 1% of circulating supply. Retail: Addresses with less than 0.1% of circulating supply. | Telegram Sentiment Uses a classification machine learning technique to determine if the texts used in the Telegram messages related to a given token have a positive, negative,orneutral connotation. | |
|---|---|---|---|---|---|---|---|---|
| $22,359,055.8110 $22,359,055.8110 | -53.15% | $107.9K | $22.36M | 1 Self Reported Circulating Supply1 Self Reported Max Supply1 | ||||
| $13,203,969.1862 $13,203,969.1862 | 1575.28% | $3.34M | $13.2T | 1M Self Reported Circulating Supply1M Self Reported Max Supply200M | ||||
| $199,001.0926 $199,001.0926 | -71.44% | $749 | $199K | 1 Self Reported Circulating Supply1 Self Reported Max Supply1 | ||||
| $136,604.8234 $136,604.8234 | -53.95% | -- | $5.74M | 42 Self Reported Circulating Supply42 Self Reported Max Supply42 | ||||
| $118,846.7213 $118,846.7213 | 70.58% | -- | -- | 0 Percentage0.00% Circulating supply0 Maximum Supply110 | ||||
| $105,074.2876 $105,074.2876 | 24.51% | $106.32K | $2.63B | 25K Self Reported Circulating Supply25K Self Reported Max Supply25K | ||||
| $104,996.5604 $104,996.5604 | 24.68% | $73.96B | $2.09T | 19.88M Percentage94.66% Circulating supply19.88M Maximum Supply21M |
|
| ||
| $104,540.7132 $104,540.7132 | 24.42% | $6.18M | $52.27B | 500K Self Reported Circulating Supply500K Self Reported Max Supply500K | ||||
| $103,019.8776 $103,019.8776 | 21.05% | $8.52K | -- | 0 | ||||
| $102,674.9855 $102,674.9855 | 24.62% | $223.49K | -- | 0 |
|
| ||
| $96,907.8719 $96,907.8719 | 24.15% | -- | $10.62M | 110 Self Reported Circulating Supply110 Self Reported Max Supply930 | ||||
| $96,856.6032 $96,856.6032 | 40.28% | -- | $410.67K | 5 Self Reported Circulating Supply5 Self Reported Max Supply96 | ||||
| $66,679.9581 $66,679.9581 | 96.89% | $33.37M | -- | 0 | ||||
| $16,629.2523 $16,629.2523 | -74.37% | -- | $236.47K | 15 Self Reported Circulating Supply15 Self Reported Max Supply9 | ||||
| $11,558.4118 $11,558.4118 | 1.98% | $734.41K | $34.78M | 3.01K Self Reported Circulating Supply3.01K Self Reported Max Supply25M | ||||
| $10,317.7430 $10,317.7430 | 3.04% | $8.33K | $16.71M | 1.62K Self Reported Circulating Supply1.62K Self Reported Max Supply2.03K | ||||
| $9,710.9888 $9,710.9888 | 14.36% | $967 | $97.11M | 10K Self Reported Circulating Supply10K Self Reported Max Supply50K | ||||
| $9,190.0572 $9,190.0572 | -9.32% | $4.66K | $1.38M | 150 Self Reported Circulating Supply150 Self Reported Max Supply0 | ||||
| $8,078.2741 $8,078.2741 | -52.61% | $33.16M | $302.2M | 37.41K Percentage37.41% Circulating supply37.41K Maximum Supply100K | ||||
| $7,250.1845 $7,250.1845 | 5.12% | -- | $362.51B | 50M Self Reported Circulating Supply50M Self Reported Max Supply50M | ||||
| $5,301.4424 $5,301.4424 | -11.97% | -- | $53.01M | 10K Self Reported Circulating Supply10K Self Reported Max Supply10K | ||||
| $5,210.2171 $5,210.2171 | -11.71% | $23.76K | -- | 0 | ||||
| $5,095.7676 $5,095.7676 | -0.43% | $25.88M | $172.3M | 33.81K |
|
| ||
| $3,541.3999 $3,541.3999 | 12.93% | $13.86M | $11.39B | 3.22M Self Reported Circulating Supply3.22M Self Reported Max Supply3.22M | ||||
| $3,456.7443 $3,456.7443 | 15.37% | $205.33M | $836.93M | 242.12K |
|
| ||
| $3,450.7130 $3,450.7130 | 15.74% | $724.04K | $7.1M | 2.06K Self Reported Circulating Supply2.06K Self Reported Max Supply2.06K | ||||
| $3,435.6145 $3,435.6145 | 14.99% | $73.39M | $846.96M | 246.52K |
|
| ||
| $3,302.8324 $3,302.8324 | 10.27% | $49 | $9.91B | 3M Self Reported Circulating Supply3M Self Reported Max Supply10M | ||||
| $2,805.4224 $2,805.4224 | 34.61% | -- | -- | 0 Percentage0.00% Circulating supply0 Maximum Supply10.03K | ||||
| $2,615.5450 $2,615.5450 | 31.90% | $30.77K | $38.54M | 14.74K Self Reported Circulating Supply14.74K Self Reported Max Supply0 |
Latest Crypto News
-

-

-

-

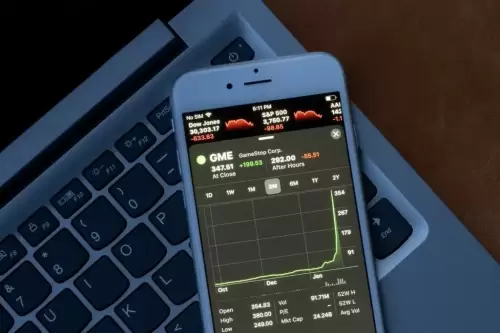
- GameStop-Themed Meme Coin (GME) Soars 532% After the Video Game Retailer Announces $1.75B Notes Offering
- Jun 12,2025 at 12:24pm
- A cryptocurrency named after GameStop Corp. GME blasted to triple-digit gains Wednesday after the video game retailer announced plans to raise over a billion dollars for investment purposes.
-

-


