 |
|
 |
|
 |
|
 |
|
 |
|
 |
|
 |
|
 |
|
 |
|
 |
|
 |
|
 |
|
 |
|
 |
|
 |
|
일반적인 암호화 시장 반등 속에서 Sui는 군중에서 눈에 띄고 두 번째로 높은 주당 점수로 67.21%증가했습니다.

In the realm of cryptocurrency, where fortunes can be made and lost in the blink of an eye, one coin has been turning heads with its staggering gains. SUI, the prominent altcoin known for its role in the Sui blockchain ecosystem, has emerged as the second-highest weekly gainer, showcasing an impressive 67.21% increase.
눈의 깜박임으로 운이 나오고 잃어 버릴 수있는 cryptocurrency의 영역에서, 한 동전은 엄청난 이익으로 머리를 돌리고 있습니다. SUI 블록 체인 생태계에서 그 역할로 유명한 저명한 알트 코인 인 Sui는 두 번째로 높은 주간 점수로 67.21% 증가한 것으로 나타났습니다.
However, as SUI’s recent rally begins to wind down, technical indicators are suggesting that the altcoin could be headed for a correction from the highs reached.
그러나 SUI의 최근 집회가 시작되기 시작함에 따라 기술 지표는 Altcoin이 도달 한 최고 수정으로 향할 수 있음을 시사합니다.
With an annual increase of 192.70%, SUI has been a major headliner of the current market cycle. The altcoin is also up 55.64% in the past month, highlighting the coin’s consistent gains throughout the past year.
SUI는 연간 192.70%의 증가로 현재 시장주기의 주요 헤드 라이너였습니다. Altcoin은 지난 달에 55.64% 증가하여 지난 1 년간 동전의 일관된 이익을 강조했습니다.
SUI is currently trading at $3.44, with a 24-hour trading volume of $2.04 billion. The coin’s market cap is now valued at $3.34 billion, ranking it 47th overall.
SUI는 현재 3.44 달러로 24 시간 거래량이 244 억 달러로 거래되고 있습니다. 코인의 시가 총액은 현재 334 억 달러로 전체적으로 47 위를 차지했습니다.
SUI’s price has pulled back slightly in recent trades, decreasing by 5.7% in the past 24 hours. Still, the coin is showing a 14.98% gain in the past week.
Sui의 가격은 최근 거래에서 약간 철회되어 지난 24 시간 동안 5.7% 감소했습니다. 그럼에도 불구하고 코인은 지난 주에 14.98%의 이익을 보여주고 있습니다.
SUI surges to classic Fibonacci target on way to 50% correction? - More Crypto OnlineAfter a stellar performance that saw SUI become the second-highest weekly gainer with a 67.21% surge and bring its annual gains to 192.70%, the prominent altcoin could be headed for a correction.
Sui는 50%의 수정으로 고전적인 Fibonacci 대상으로 급증합니까? - 이후에 더 많은 암호화는 Sui가 67.21%의 급증으로 두 번째로 높은 주간 이익을 얻었고 연간 이익을 192.70%로 가져 오는 훌륭한 성능을 보인다.
As shared by the X market analytics handle More Crypto Online on Friday, SUI’s bullish performance in the past week means the altcoin has surged to the 178.6% Fibonacci extension level around $3.71. This specified Fibonacci level represents a major technical milestone as it is a classic target area in Wave 3 in the Elliott Wave analysis.
X Market Analytics가 공유 한 바와 같이, 금요일에 온라인으로 더 많은 암호화를 처리 한 바와 같이, 지난 주 Sui의 강세 성과는 Altcoin이 178.6% Fibonacci Extension 수준에 약 3.71 달러로 급증했음을 의미합니다. 이 지정된 Fibonacci 수준은 Elliott Wave Analysis에서 Wave 3의 고전적인 목표 영역이므로 주요 기술 이정표를 나타냅니다.
For context, the Elliott Wave theory postulates that price movements occur in five recurring wave patterns. Among these, Wave 3 is usually regarded as the strongest and longest wave in a bullish trend. It is a wave of confirmation indicating a robust market participation.
맥락에서, Elliott Wave 이론은 가격 변동이 5 개의 반복되는 파도 패턴으로 발생한다고 가정합니다. 이 중에서, 3 웨이브 3은 일반적으로 낙관적 인 트렌드에서 가장 강력하고 가장 긴파로 간주됩니다. 그것은 강력한 시장 참여를 나타내는 확인의 물결입니다.
Currently, SUI is completing the final stages of Wave 3, having surpassed the minimum Fibonacci extension level of 138%. As expected, signs of waning demand are beginning to set in, evidenced by today’s 5.7% retracement.
현재 SUI는 Wave 3의 최종 단계를 완료하여 최소 Fibonacci 확장 수준 138%를 능가했습니다. 예상 한 바와 같이, 오늘의 5.7% 후퇴에 의해 입증 된 수요의 징후가 시작되었습니다.
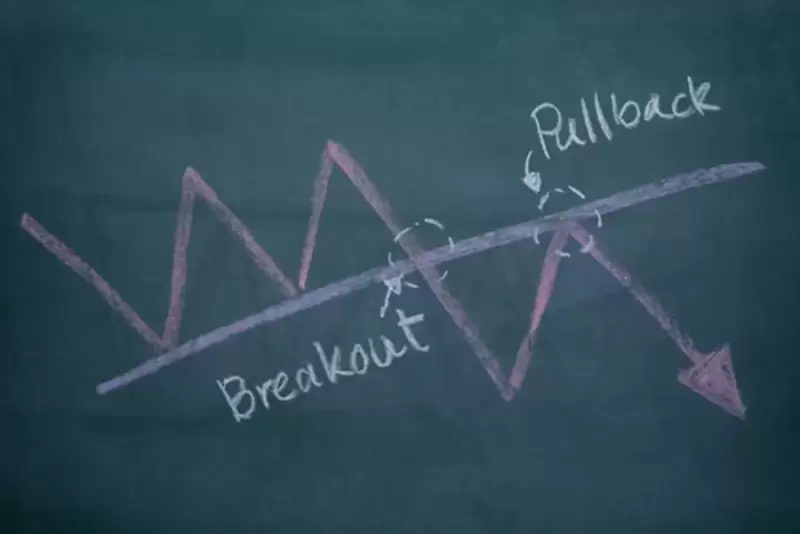
Elliott Wave Count Suggests Pullback Looms For SUI
Elliott Wave Count는 Sui의 풀백 직기를 제안합니다
This aligns with the potential for Wave 4 to emerge now, setting the stage for SUI to experience a price pullback. The initial support zone for this move is at $3.27. A decisive price break below this level would confirm the end of Wave 3 and the beginning of Wave 4.
이는 Wave 4가 이제 등장 할 가능성과 일치하며 SUI가 가격표를 경험할 수있는 단계를 설정합니다. 이 움직임의 초기 지원 구역은 $ 3.27입니다. 이 수준 이하의 결정적인 가격 중단은 Wave 3의 끝과 Wave 4의 시작을 확인합니다.
Further market support lies between $2.95 and $2.75, which represents the 38.2% – 50% Fibonacci retracement zone of the Wave 3 move. This price region is the support target zone for a healthy Wave 4 correction.
추가 시장 지원은 $ 2.95에서 $ 2.75 사이이며, 이는 Wave 3 이동의 38.2% - 50% Fibonacci retression Zone을 나타냅니다. 이 가격 지역은 건강한 Wave 4 보정을위한 지원 목표 영역입니다.
If buyers retain this price zone, it will set the stage for SUI to break out of the potential triple-three pattern (W-M-W) and continue the bullish structure. A deeper retracement could open the door for a larger and more significant Wave 5 move.
구매자 가이 가격대를 유지하면 SUI가 잠재적 인 트리플 3 패턴 (WMW)에서 벗어나 강세 구조를 계속할 수있는 단계를 설정합니다. 더 깊은 되돌아 가면 더 크고 더 중요한 Wave 5 이동을 위해 문을 열 수 있습니다.
The post Elliott Wave Count Suggests Pullback Looms For SUI appeared first on MoreCrypto.
Elliott Wave Count는 Sui의 풀백 직기가 Morecrypto에서 처음 등장했음을 암시합니다.
부인 성명:info@kdj.com
제공된 정보는 거래 조언이 아닙니다. kdj.com은 이 기사에 제공된 정보를 기반으로 이루어진 투자에 대해 어떠한 책임도 지지 않습니다. 암호화폐는 변동성이 매우 높으므로 철저한 조사 후 신중하게 투자하는 것이 좋습니다!
본 웹사이트에 사용된 내용이 귀하의 저작권을 침해한다고 판단되는 경우, 즉시 당사(info@kdj.com)로 연락주시면 즉시 삭제하도록 하겠습니다.


