 |
|
 |
|
 |
|
 |
|
 |
|
 |
|
 |
|
 |
|
 |
|
 |
|
 |
|
 |
|
 |
|
 |
|
 |
|
Solana Sol $ 150.7 24h 변동성 : 2.6% 시가 총액 : $ 78.04 B Vol. 24h : $ 3.80 b
Solana (CRYPTO: SOL) price was up 4.3% over 24 hours on Monday evening, continuing a recent rally that has seen the cryptocurrency climb 35% in seven days.
Solana (Crypto : Sol) 가격은 월요일 저녁에 24 시간 동안 4.3% 상승하여 최근 암호 화폐가 7 일 동안 35% 상승한 것을 보았습니다.
What Happened: According to data from Benzinga Pro, Solana was trading at $150.7 by Monday evening, having reached a 24-hour peak of $156.97. The cryptocurrency’s 24-hour volume was up 70%, and its market cap was estimated at $78.04 billion, making it the sixth-largest cryptocurrency.
무슨 일이 있었는지 : Benzinga Pro의 데이터에 따르면 Solana는 월요일 저녁까지 150.7 달러에 거래를했으며 24 시간 최고 $ 156.97에 도달했습니다. cryptocurrency의 24 시간 볼륨은 70%증가했으며 시가 총액은 784 억 달러로 추정되어 6 번째로 큰 cryptocurrency입니다.
Solana’s price movements align with a 3.3% rise in the broader cryptocurrency market, which saw total market capitalization fall back below $3.4 trillion.
Solana의 가격 변동은 더 넓은 cryptocurrency 시장의 3.3% 상승과 일치하여 총 시가 총액이 3.4 조 달러 미만으로 떨어졌습니다.
Recent on-chain data from Glassnode shows a clear uptick in Solana network usage, with active wallet addresses climbing steadily over the past week.
GlassNode의 최근 온쇄 데이터는 Solana 네트워크 사용이 명확하게 증가한 것으로 나타 났으며, 지난 주 동안 활성 지갑 주소가 꾸준히 등반됩니다.
Plus, in the past day, the network has recorded a 4.26% uptick in its total value locked (TVL), currently sitting at $9.53 billion.
또한 지난 날, 네트워크는 현재 총 가치 잠금 (TVL)이 4.26% 상승했으며 현재 953 억 달러에 달했습니다.
Meanwhile, SOL outflows from exchanges have accelerated: holders withdrew over $16 million worth of SOL this week, following $107 million in withdrawals last week. Historically, large outflows suggest that investors are preparing for further price gains by shifting towards self-custody.
한편, 거래소의 SOL 유출은 가속화되었다. 보유자들은 지난 주 1 억 7 천만 달러의 인출에 이어 이번 주 1,600 만 달러 이상의 SOL을 철회했다. 역사적으로, 큰 유출은 투자자들이 자기 지속권으로 이동함으로써 추가 가격 상승을 준비하고 있다고 제안합니다.
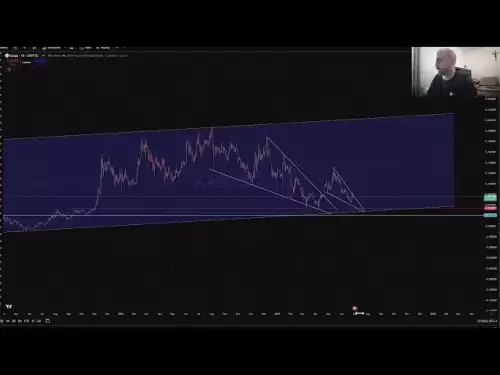
What’s Next For SOL PriceAnalyst Ali Martinez observed that SOL has been trading within a clear upward channel since May 12. He suggested that the cryptocurrency could test the upper boundary of the channel, estimated to be around $210.
Sol PriceAnalyst Ali Martinez의 다음 단계는 Sol이 5 월 12 일부터 명확한 상향 채널 내에서 거래되고 있음을 관찰했습니다. 그는 암호 화폐가 채널의 상한을 테스트 할 수 있으며 약 210 달러로 추정됩니다.
#Solana $SOL has been trading in a clear uptrend channel since May 12.
#Solana $ Sol은 5 월 12 일부터 Clear Uptrend 채널에서 거래하고 있습니다.
The price is now approaching the upper boundary of this channel, with $210 in sight! pic.twitter.com/Iido4VThxz— Ali (@ali_charts) May 22, 2024Popular crypto trader Jelle also expressed bullish sentiment on X. He stated that once SOL manages to close above the $250 resistance level, it’s likely to continue rallying toward the $400 mark.
가격은 이제이 채널의 상한에 접근하고 있으며 210 달러가 보이고 있습니다! pic.twitter.com/iido4vthxz— ali (@ali_charts) 2024 년 5 월 22 일, Popular crypto trader Jelle은 또한 X에 대한 강세 감정을 표현했다.
It's a good thing I still own a bunch of $SOL.
내가 아직도 $ Sol을 소유하고있는 것은 좋은 일입니다.
Once it clears $250, I doubt it stops before it hits $400-$500.
$ 250를 삭감하면 $ 400- $ 500에 맞기 전에 멈추지 않습니다.
All the weak hands have been shaken out.
모든 약한 손이 흔들렸다.
Time to reap the rewards.
보상을 거두는 시간.
— Jelle (@CryptoJelleNL) May 22, 2024On the daily chart, price is nearing the upper Bollinger Band, signifying a sustained uptrend. The middle band, serving as the 20-day Simple Moving Average (SMA), provides immediate support at around $165 to the cryptocurrency.
- Jelle (@cryptojellenl) 2024 년 5 월 22 일 일일 차트, 가격은 어퍼 볼린저 밴드와 가까워지고 지속적인 업 트렌드를 나타냅니다. 20 일 간단한 이동 평균 (SMA) 역할을하는 중간 밴드는 암호 화폐에 약 165 달러에 즉각적인 지원을 제공합니다.
Key resistance lies at $190 as it coincides with the upper Bollinger boundary, and further up, we have $210, which is identified by an ascending channel pattern on the four-hour chart.
주요 저항은 상단 볼린저 경계와 일치하므로 190 달러에 달하며, 210 달러가 있으며, 이는 4 시간 차트에서 상승하는 채널 패턴으로 식별됩니다.
SOL price chart with RSI and Bollinger Bands | Source: Trading viewThe Relative Strength Index (RSI) has climbed to the mid-60s, indicating bullish sentiment. There is still scope for more bullish advances before we might see some corrective pullback.
RSI 및 Bollinger Bands가있는 SOL 가격 차트 | 출처 : 거래보기 상대 강도 지수 (RSI)는 60 년대 중반으로 올라 갔으며, 이는 강세의 감정을 나타냅니다. 우리가 시정이되기 전에 더 많은 낙관적 발전에 대한 범위가 여전히 있습니다.
The MACD is poised for a bullish crossover, while the histogram bars are currently in red. However, the decreasing height of the bars from the previous day confirms the increasing bullish momentum for SOL.
MACD는 낙관적 인 크로스 오버를 위해 준비되며 히스토그램 막대는 현재 빨간색입니다. 그러나 전날의 막대의 높이 감소는 Sol에 대한 낙관적 추진력이 증가 함을 확인합니다.
부인 성명:info@kdj.com
제공된 정보는 거래 조언이 아닙니다. kdj.com은 이 기사에 제공된 정보를 기반으로 이루어진 투자에 대해 어떠한 책임도 지지 않습니다. 암호화폐는 변동성이 매우 높으므로 철저한 조사 후 신중하게 투자하는 것이 좋습니다!
본 웹사이트에 사용된 내용이 귀하의 저작권을 침해한다고 판단되는 경우, 즉시 당사(info@kdj.com)로 연락주시면 즉시 삭제하도록 하겠습니다.


