 |
|
 |
|
 |
|
 |
|
 |
|
 |
|
 |
|
 |
|
 |
|
 |
|
 |
|
 |
|
 |
|
 |
|
 |
|
基本から始めましょう。 suiとは何ですか? SUIは、Mysten Labsによって構築されたレイヤー1ブロックチェーンで、スケーラビリティを念頭に置いて設計されています。

Let's start with the basics.What is SUI?
基本から始めましょう。SUIとは何ですか?
SUI is a Layer 1 blockchain built by Mysten Labs, designed with scalability in mind. It leverages the Move programming language and aims to offer fast, low-latency, high-throughput transactions — making it perfect for next-gen dApps, especially those with heavy user interaction.
SUIは、Mysten Labsによって構築されたレイヤー1ブロックチェーンで、スケーラビリティを念頭に置いて設計されています。 Moveプログラミング言語を活用し、高速で低遅延のハイスループットトランザクションを提供することを目的としています。これは、特にヘビーユーザーの相互作用を持つ次世代のダップに最適です。
Okay, that’s the boring intro over. Let’s talk about what really matters: price action.
さて、それは退屈なイントロです。本当に重要なことについて話しましょう:価格アクション。
Daily Chart – Supply Reaction and the Drop That Followed
毎日のチャート - 供給反応とその後のドロップ
If you’ve been following SUI closely (like I have), then this probably won’t surprise you: price reacted perfectly off the daily supply we talked about last time.
あなたが(私が持っているように)SUIを密接にフォローしているなら、これはおそらくあなたを驚かせることはありません。
And no, that wasn’t some random area we drew for fun. It was real. It was clean. And the rejection? Brutal. Almost surgical.
いいえ、それは私たちが楽しみのために描いたランダムな領域ではありませんでした。それは本物でした。きれいでした。そして拒絶?残忍な。ほとんど外科的。
Now here’s the real question:How low could SUI go from here?
これが本当の質問です:SUIはここからどれだけ低くなるでしょうか?
If you ask me — and you’re here, so I guess you are — the area between $3.44 and $3.23 is where I’ve got my eyes locked. That zone is a daily demand, and guess what? That’s where the last major impulse started. It wouldn’t surprise me one bit if price comes down there for a visit… and maybe even decides to bounce.
あなたが私に尋ねると、そしてあなたがここにいるので、私はあなたがいると思います - 3.44ドルから3.23ドルの間の面積は私が目を閉じている場所です。そのゾーンは毎日の需要であり、何を推測しますか?それが最後の主要な衝動が始まったところです。価格が訪問のためにそこに降りてくるなら、それは私を少し驚かせることはないでしょう...そしておそらくバウンスすることさえ決めています。
H4 Chart – Liquidity Games and Trendline Drama
H4チャート - 流動性ゲームとトレンドラインドラマ
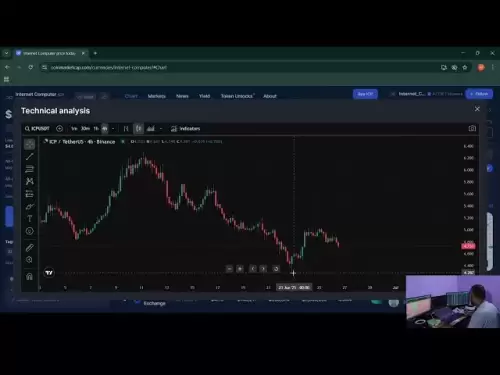
Zooming into the 4H timeframe, there’s something else I can’t ignore. Price is forming a trendline with liquidity stacking above. Yep. One of those setups.
4Hの時間枠にズームインすると、無視できないものがあります。価格は、上記の流動性スタッキングでトレンドラインを形成しています。うん。それらのセットアップの1つ。
And if you’ve been around the charts for a while, you know what happens to clean trendlines…They rarely end nicely for those relying on them blindly.
そして、もしあなたがしばらくの間チャートの周りにいたなら、あなたはトレンドラインをきれいにするために何が起こるかを知っています...彼らは盲目的にそれらに頼る人々のためにうまく終わることはめったにありません。
In fact, this reminds me of the time I held a textbook trendline bounce — only to watch price spike through it, tap demand, and then fly.This could be one of those moments.
実際、これは私が教科書のトレンドラインバウンスを開催した時間を思い出させます - 価格の急上昇、タップ需要、そして飛ぶだけです。これはその瞬間の1つかもしれません。
The liquidity sitting above could act like a magnet — but only after we see some real reaction from that $3.4–$3.2 demand. That’s the key zone. Eyes on it.
上に座っている流動性は磁石のように振る舞う可能性がありますが、3.4〜3.2ドルの需要からの実際の反応が見られた後です。それがキーゾーンです。それに目を向けます。
What If We’re Wrong?
私たちが間違っている場合はどうなりますか?
Look, I’ll keep it real.
ほら、私はそれを本物に保ちます。
This is not a guaranteed outcome. Not even close. The market doesn’t care about our plans. It could smash through that demand, take out liquidity below, and rewrite the playbook on the spot.
これは保証された結果ではありません。近くにさえありません。市場は私たちの計画を気にしません。その需要を破壊し、以下の流動性を取り除き、その場でプレイブックを書き直すことができます。
These aren’t certainties — they’re probabilities.And in this game? Probabilities are all we’ve got.
これらは確実ではありません - それらは確率です。そして、このゲームでは?確率は私たちが持っているすべてです。
免責事項:info@kdj.com
提供される情報は取引に関するアドバイスではありません。 kdj.com は、この記事で提供される情報に基づいて行われた投資に対して一切の責任を負いません。暗号通貨は変動性が高いため、十分な調査を行った上で慎重に投資することを強くお勧めします。
このウェブサイトで使用されているコンテンツが著作権を侵害していると思われる場合は、直ちに当社 (info@kdj.com) までご連絡ください。速やかに削除させていただきます。


