 |
|
 |
|
 |
|
 |
|
 |
|
 |
|
 |
|
 |
|
 |
|
 |
|
 |
|
 |
|
 |
|
 |
|
 |
|
90% の暴落の後、Pi Network は反転する準備ができていますか?主要なサポート レベル、技術指標、戦略的銀行パートナーシップを分析します。
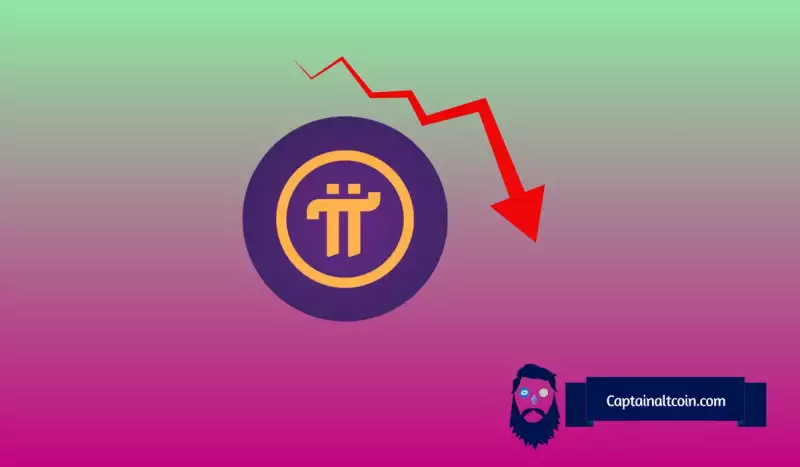
Pi Network has seen a lot of buzz, especially after its token launched earlier this year. But after a quick spike, the price took a nosedive. Now, everyone's wondering: Is a crash reversal on the horizon, or is there more downside to come?
Pi Network は、特に今年初めにトークンが発売されて以来、多くの話題を呼びました。しかし、急騰した後、価格は急落しました。今、誰もが疑問に思っています。暴落の反転は近いのか、それともさらなる下落局面が訪れるのか?
Key Support Level: $0.20
主要サポートレベル: $0.20
The price of Pi coin is currently hovering around $0.20. This level has proven to be a key support zone, with buyers consistently stepping in to defend it. This accumulation suggests that sentiment around the token might be improving.
Piコインの価格は現在0.20ドル付近で推移している。このレベルは重要なサポートゾーンであることが証明されており、買い手が一貫してこのレベルを守るために介入しています。この蓄積は、トークンに対するセンチメントが改善している可能性があることを示唆しています。
Technical Indicators: Mixed Signals
テクニカル指標: ミックスシグナル
Looking at technical indicators, we get a mixed bag:
テクニカル指標を見ると、さまざまな状況がわかります。
- RSI: At 29.543, the Relative Strength Index (RSI) points to oversold conditions, often preceding a short-term rebound.
- STOCH: The Stochastic Oscillator at 40.855 leans bearish, indicating weak momentum.
- MACD: The Moving Average Convergence Divergence (MACD) at -0.024 confirms the negative sentiment.
- ATR: The Average True Range (ATR) at 0.018 signals lower volatility, suggesting consolidation before the next big move.
- Ultimate Oscillator: Hovering near 49.534, the Ultimate Oscillator shows balance between buyers and sellers.
Descending Channel Pattern
降順チャネル パターン
The price has been in a descending channel since mid-May. This pattern has been tightening recently, often signaling an approaching breakout. A break above the wedge resistance line could trigger a rally, potentially pushing the price toward $0.86, and if momentum builds, even toward the $1 area. On the flip side, failure to maintain the $0.19 support level could lead to further losses.
5月中旬以降、価格は下落傾向にある。このパターンは最近タイト化しており、多くの場合ブレイクアウトが近づいていることを示しています。ウェッジのレジスタンスラインを上抜ければ反発が起こり、価格が0.86ドルに向けて押し上げられる可能性があり、勢いが強まれば1ドルの領域にまで押し上げる可能性もある。逆に、0.19ドルのサポートレベルを維持できない場合は、さらなる損失につながる可能性があります。
Strategic Banking Partnerships
戦略的銀行パートナーシップ
Pi Network is making moves to integrate Picoin into traditional financial systems. Strategic banking partnerships with top institutions in China, Nigeria, and other key markets aim to bridge the gap between Web3 and traditional banking. This initiative seeks to legitimize Picoin and enable users to transact through familiar banking channels.
Pi Network は、Picoin を従来の金融システムに統合する取り組みを行っています。中国、ナイジェリア、その他の主要市場のトップ機関との戦略的銀行提携は、Web3 と従来の銀行業務の間のギャップを埋めることを目的としています。この取り組みは、Picoin を合法化し、ユーザーが使い慣れた銀行チャネルを通じて取引できるようにすることを目指しています。
The Future of Pi Network
Pi ネットワークの将来
Pi Network's approach of working with regulated institutions sets a new standard for responsible crypto growth. By embedding its technology into everyday financial services, Pi is breaking through digital-only environments.
規制された機関と協力するという Pi Network のアプローチは、責任ある仮想通貨の成長に対する新たな基準を設定します。 Pi は、そのテクノロジーを日常の金融サービスに組み込むことで、デジタルのみの環境を打破しています。
Final Thoughts
最終的な考え
So, is a crash reversal finally here for Pi Network? It's tough to say for sure. The technical indicators are mixed, but the strategic banking partnerships could be a game-changer. Keep an eye on that $0.20 support level and watch for a breakout from the descending channel. Either way, it's gonna be interesting to watch where Pi goes from here!
では、ついに Pi Network に暴落の反転が訪れるのでしょうか?確かに言うのは難しいです。テクニカル指標はまちまちだが、戦略的銀行提携は状況を一変させる可能性がある。 0.20ドルのサポートレベルに注目し、下降チャネルからのブレイクアウトに注目してください。いずれにせよ、パイがここからどうなるかを見るのは興味深いでしょう!
免責事項:info@kdj.com
提供される情報は取引に関するアドバイスではありません。 kdj.com は、この記事で提供される情報に基づいて行われた投資に対して一切の責任を負いません。暗号通貨は変動性が高いため、十分な調査を行った上で慎重に投資することを強くお勧めします。
このウェブサイトで使用されているコンテンツが著作権を侵害していると思われる場合は、直ちに当社 (info@kdj.com) までご連絡ください。速やかに削除させていただきます。


