 |
|
 |
|
 |
|
 |
|
 |
|
 |
|
 |
|
 |
|
 |
|
 |
|
 |
|
 |
|
 |
|
 |
|
 |
|
グレースケールの包含のHBAR価格は、重要な抵抗レベルをテストします。雄牛は勢いを維持し、HBARを新たな高みに押しますか?

HBAR is making moves! Riding high on Grayscale's decision to include it in their Smart Contract Platform Fund, HBAR's price is testing a crucial resistance level of $0.18. The question now is, can the bulls keep the momentum going?
Hbarは動きをしています! HBARの価格は、Grayscaleがスマートコントラクトプラットフォームファンドに含めるという決定に高いと、0.18ドルの重要な抵抗レベルをテストしています。今の問題は、雄牛が勢いを続けることができるのかということです。
HBAR's Bullish Momentum: A Deep Dive
Hbarの強気の勢い:深いダイビング
On July 9, 2025, HBAR witnessed a price increase of over 5%, fueled by Grayscale's announcement. This sustained investor interest highlights HBAR's growing prominence alongside Ethereum, Solana, and Cardano.
2025年7月9日、HBARは5%以上の価格上昇を目撃し、Grayscaleの発表に支えられました。この持続的な投資家の関心は、イーサリアム、ソラナ、カルダノとともに、HBARの卓越性の高まりを強調しています。
According to Grayscale's updated GSC fund allocation, HBAR now holds approximately 5.8% weight, placing it ahead of Avalanche. This move solidifies HBAR's position in institutional conversations.
Grayscaleの更新されたGSCファンドの割り当てによると、HBARは現在約5.8%の重量を保持しており、雪崩の前に置いています。この動きは、制度的会話におけるHBARの立場を固めます。
Technical Analysis: Double-Bottom Pattern in Play
テクニカル分析:再生中の二重底パターン
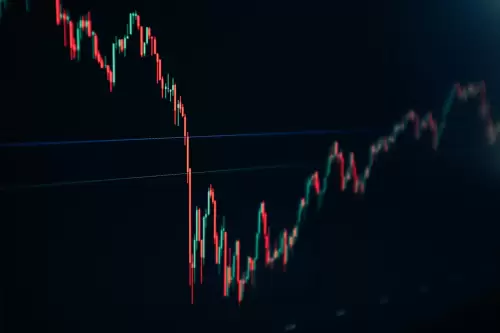
The HBAR daily price chart reveals a classic double-bottom reversal pattern, with lows at $0.13 in mid-April and late June. This bullish setup suggests a potential 60% breakout if confirmed by a close above the neckline resistance near $0.22.
HBAR Daily Price Chartは、4月中旬と6月下旬に0.13ドルで、クラシックな二重底の反転パターンを明らかにしています。この強気のセットアップは、$ 0.22近くのネックライン抵抗の上の近くで確認された場合、潜在的な60%のブレイクアウトを示唆しています。
If the bulls manage a decisive close above $0.18, the technical projection from the double-bottom pattern points to the next major target at $0.28, aligning with a previous rejection in March. However, failure to surpass $0.18 could lead to consolidation back to the $0.15 level, with solid support from the EMA and Bollinger mid-band.
ブルズが0.18ドルを超える決定的な閉鎖を管理する場合、二重底パターンから次の主要なターゲットを0.28ドルで指し示し、3月の以前の拒否と協力します。ただし、0.18ドルを上回らないと、EMAとBollingerのミッドバンドからの確固たるサポートにより、0.15ドルのレベルに戻る統合につながる可能性があります。
Solaxy: A Solana Layer 2 Catching the Eye of HBAR Bulls
Solaxy:Hbar Bullsの目を引くSolana Layer2
With HBAR benefiting from institutional tailwinds, investors are also exploring early-stage opportunities like Solaxy, Solana’s first Layer 2 solution. Solaxy combines meme appeal with real Layer 2 infrastructure, attracting both retail and corporate traders.
HBARが機関の追い風の恩恵を受けているため、投資家はSolanaの最初のレイヤー2ソリューションであるSolaxyのような初期段階の機会も模索しています。 Solaxyは、Meme AppealとReal Layer 2のインフラストラクチャを組み合わせて、小売業と企業トレーダーの両方を引き付けます。
Currently in presale, the $SOLX token offers staking APY as high as 71%, drawing attention from HBAR and Solana holders seeking early exposure to the next L2 breakout.
現在、$ Solx Tokenは71%のステーキングAPYを提供し、HBARとSolanaの所有者から次のL2ブレイクアウトへの早期暴露を求めて注目を集めています。
Potential Roadblocks and Considerations
潜在的な障害と考慮事項
While the technical indicators suggest a bullish outlook, the Relative Strength Index (RSI) reading of 62.04 signals potential overheating, advising caution as the price tests key resistance at $0.18. It's essential to watch for any signs of long-term holders taking profits, which could trigger a temporary pullback.
技術的指標は強気の見通しを示唆していますが、62.04の相対強度指数(RSI)の読み取り値は潜在的な過熱を示し、価格テストが0.18ドルの重要な抵抗として注意を払っています。一時的なプルバックを引き起こす可能性のある長期保有者の兆候を監視することが不可欠です。
Final Thoughts: Will HBAR's Bulls Conquer $0.18?
最終的な考え:Hbarの雄牛は0.18ドルを征服しますか?
HBAR's recent surge is exciting, and the technicals look promising. However, like navigating the NYC subway during rush hour, a little caution can save you from getting squished. Keep an eye on that $0.18 resistance – if HBAR breaks through, we could be looking at a whole new ballgame. If not, well, there's always the next train (or in this case, the next bullish run)!
Hbarの最近の急増はエキサイティングであり、技術は有望に見えます。ただし、ラッシュアワー中にNYCの地下鉄をナビゲートするように、少し注意することで、あなたを押しつぶされることを救うことができます。 0.18ドルの抵抗に注意してください。HBARが突破した場合、まったく新しい球技を見ることができます。そうでない場合、まあ、常に次の列車(またはこの場合、次の強気の走り)があります!
免責事項:info@kdj.com
提供される情報は取引に関するアドバイスではありません。 kdj.com は、この記事で提供される情報に基づいて行われた投資に対して一切の責任を負いません。暗号通貨は変動性が高いため、十分な調査を行った上で慎重に投資することを強くお勧めします。
このウェブサイトで使用されているコンテンツが著作権を侵害していると思われる場合は、直ちに当社 (info@kdj.com) までご連絡ください。速やかに削除させていただきます。


