 |
|
 |
|
 |
|
 |
|
 |
|
 |
|
 |
|
 |
|
 |
|
 |
|
 |
|
 |
|
 |
|
 |
|
 |
|
Ethereumは、最近の取引セッションで新たな強さを示しており、新たな増加を開始する前に、2,440ドルのレベルで堅実なサポートを見つけています。
Ethereum price has shown renewed strength in recent trading sessions as the second-largest cryptocurrency found support around $2,440 before starting a fresh increase.
2番目に大きい暗号通貨が新たな増加を開始する前に約2,440ドルのサポートを見つけたため、イーサリアムの価格は最近の取引セッションで新たな強さを示しています。
After dropping to lows of $2,442, buyers emerged and pushed the cryptocurrency higher. This led to a recovery of the $2,500 mark amid rising buying pressure from whale accounts.
2,442ドルの最低値に落ちた後、バイヤーは出現し、暗号通貨を高くしました。これにより、クジラの口座からの購入圧力が上昇する中、2,500ドルのマークが回復しました。
At the time of writing, ETH is trading at $2,580 as it erodes the 50% Fibonacci retracement level of the downward wave from the $2,615 swing high to the $2,442 low.
執筆時点では、ETHは2,580ドルで取引されています。これは、下向きの波の50%のフィボナッチリトレースメントレベルを2,615ドルのスイングから2,442ドルの安値まで侵食しています。
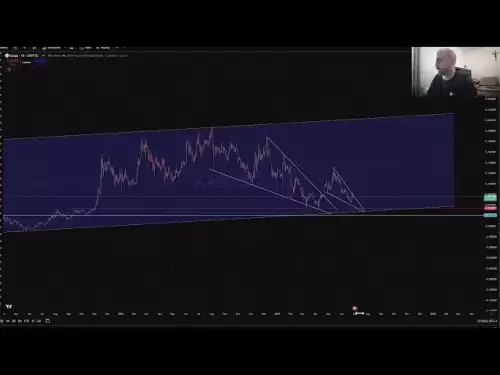
A connecting bullish trend line has formed with support at $2,500 on the hourly chart of ETH/USD.
ETH/USDの1時間ごとのチャートで、接続の強気トレンドラインが2,500ドルでサポートされています。
Ethereum is now trading above $2,520 and the 100-hourly Simple Moving Average. The upward momentum coincides with declining exchange supply, which has reached its lowest point since August 2024.
Ethereumは現在、2,520ドルを超え、100時間の単純な移動平均を取引しています。上向きの勢いは、2024年8月以来最も低いポイントに達した交換供給の減少と一致しています。
Since April 24, more than 1 million ETH have left exchanges for private wallets, suggesting increased long-term holding behavior among investors.
4月24日以来、100万人以上のETHがプライベートウォレットとの交換を去り、投資家の長期保有行動の増加を示唆しています。
Despite the dominant spot buying pressure, ETH continues to move range-bound near the $2,500 mark.
支配的なスポットの購入プレッシャーにもかかわらず、ETHは2,500ドルのマークの近くで範囲に縛られ続けています。
Trading volume increases whenever prices move below or above this level, making $2,500 a critical threshold that could determine Ethereum’s next major trend.
価格がこのレベルを下回るか、2,500ドルを下回ると、取引量が増加し、イーサリアムの次の主要な傾向を決定できる重要なしきい値になります。
Looking at the technical indicators, the Relative Strength Index (RSI) is trending horizontally near the overbought region, indicating slight weakness in the bullish momentum.
技術的指標を見ると、相対強度指数(RSI)は、過剰な領域の近くで水平方向に流れており、強気の勢いのわずかな弱さを示しています。
Meanwhile, the Moving Average Convergence Divergence (MACD) is testing its moving average line as its histogram bars approach negative territory.
一方、移動平均収束発散(MACD)は、ヒストグラムバーが負の領域に近づくにつれて、移動平均ラインをテストしています。
On the upside, Ethereum could face resistance near $2,620, with the next key resistance around $2,650. The first major resistance sits near the $2,720 level.
利点として、イーサリアムは2,620ドル近くの抵抗に直面する可能性があり、次のキーレジスタンスは約2,650ドルです。最初の主要な抵抗は、2,720ドルのレベルに近づいています。
A clear move above $2,720 might push the price toward $2,840. Breaking through this resistance could open the path to $2,920 or even the psychologically important $3,000 level in the near term.
2,720ドルを超える明確な動きは、価格を2,840ドルに押し上げる可能性があります。この抵抗を突破すると、パスが2,920ドル、または短期的には心理的に重要な3,000ドルのレベルまでの経路を開くことができます。
If Ethereum fails to clear the $2,620 resistance, it might start a fresh decline. Initial support is near $2,525, with major support at $2,500 and the trend line.
Ethereumが2,620ドルの抵抗をクリアできない場合、新たな減少を開始する可能性があります。最初のサポートは2,525ドル近く、主要なサポートは2,500ドルとトレンドラインです。
A move below $2,500 could push the price toward $2,440. Further losses might send ETH toward $2,420 or even $2,350 in the near term.
$ 2,500を下回る動きは、価格を2,440ドルに押し上げる可能性があります。さらなる損失は、ETHを2,420ドルまたは短期的に2,350ドルに送る可能性があります。
免責事項:info@kdj.com
提供される情報は取引に関するアドバイスではありません。 kdj.com は、この記事で提供される情報に基づいて行われた投資に対して一切の責任を負いません。暗号通貨は変動性が高いため、十分な調査を行った上で慎重に投資することを強くお勧めします。
このウェブサイトで使用されているコンテンツが著作権を侵害していると思われる場合は、直ちに当社 (info@kdj.com) までご連絡ください。速やかに削除させていただきます。


