








![[マルチ SUB] (全エピソード) 1994 年、チェン・イェーは帰国すると問題を抱えていました。彼の家族の財産は彼のいとこによって横領されました。彼の婚約者は考えを変えた。獣の鐘は海外への販路を開拓した。彼は獣語を理解し、金持ちになるために山の幸を拾いました。彼は元カノとの復縁を拒否した! #人気短編ドラマおすすめ#短編ドラマ全集#素晴らしい本土短編ドラマ](/uploads/2026/10/04/cryptocurrencies-news/videos/origin_6ac1ee0c8f3c7_image_500_375.webp "[マルチ SUB] (全エピソード) 1994 年、チェン・イェーは帰国すると問題を抱えていました。彼の家族の財産は彼のいとこによって横領されました。彼の婚約者は考えを変えた。獣の鐘は海外への販路を開拓した。彼は獣語を理解し、金持ちになるために山の幸を拾いました。彼は元カノとの復縁を拒否した! #人気短編ドラマおすすめ#短編ドラマ全集#素晴らしい本土短編ドラマ")






 |
|
 |
|
 |
|
 |
|
 |
|
 |
|
 |
|
 |
|
 |
|
 |
|
 |
|
 |
|
 |
|
 |
|
 |
|
The BCH price trend shows a bullish reversal from the $400 level.
ストーリーのハイライトBCH 価格の傾向は、400 ドルのレベルからの強気の反転を示しています。
A rising trend in 50W EMA teases a golden crossover with the 200W EMA.
50W EMA の上昇傾向は、200W EMA との黄金のクロスオーバーを示唆しています。
The bullish reversal aims to reclaim the $500 mark.
強気の反転は500ドルのマークを取り戻すことを目指しています。
Following a massive crash during Bitcoin’s downfall, the BCH price trend faces a small hiccup in its recovery phase. With an evening star kickstarting a bearish takeover, the altcoin finally regains momentum at $400 for a comeback.
ビットコインの下落時に大規模な暴落が発生した後、BCHの価格トレンドは回復段階で小さな問題に直面しています。宵の明星が弱気相場をスタートさせたことで、アルトコインはついに400ドルで勢いを取り戻し、巻き返しを図る。
After the much anticipated Bitcoin Halving fails to boost the market in April, a turnaround is possible in May. As the recovery rally picks up momentum, the Bitcoin Cash price could surpass the realm of triple digits. Will the Bitcoin Cash price reach $1,000 in 2024? Find out more about our BCH price prediction, which provides a long-term view.
待望されていたビットコインの半減期が4月に市場を押し上げることができなかったとしても、5月には好転する可能性がある。回復ラリーが勢いを増すにつれて、ビットコインキャッシュの価格は3桁の領域を超える可能性がある。ビットコインキャッシュの価格は2024年に1,000ドルに達するでしょうか?長期的な視点を提供する BCH 価格予測の詳細をご覧ください。
Bitcoin Cash Price Performance
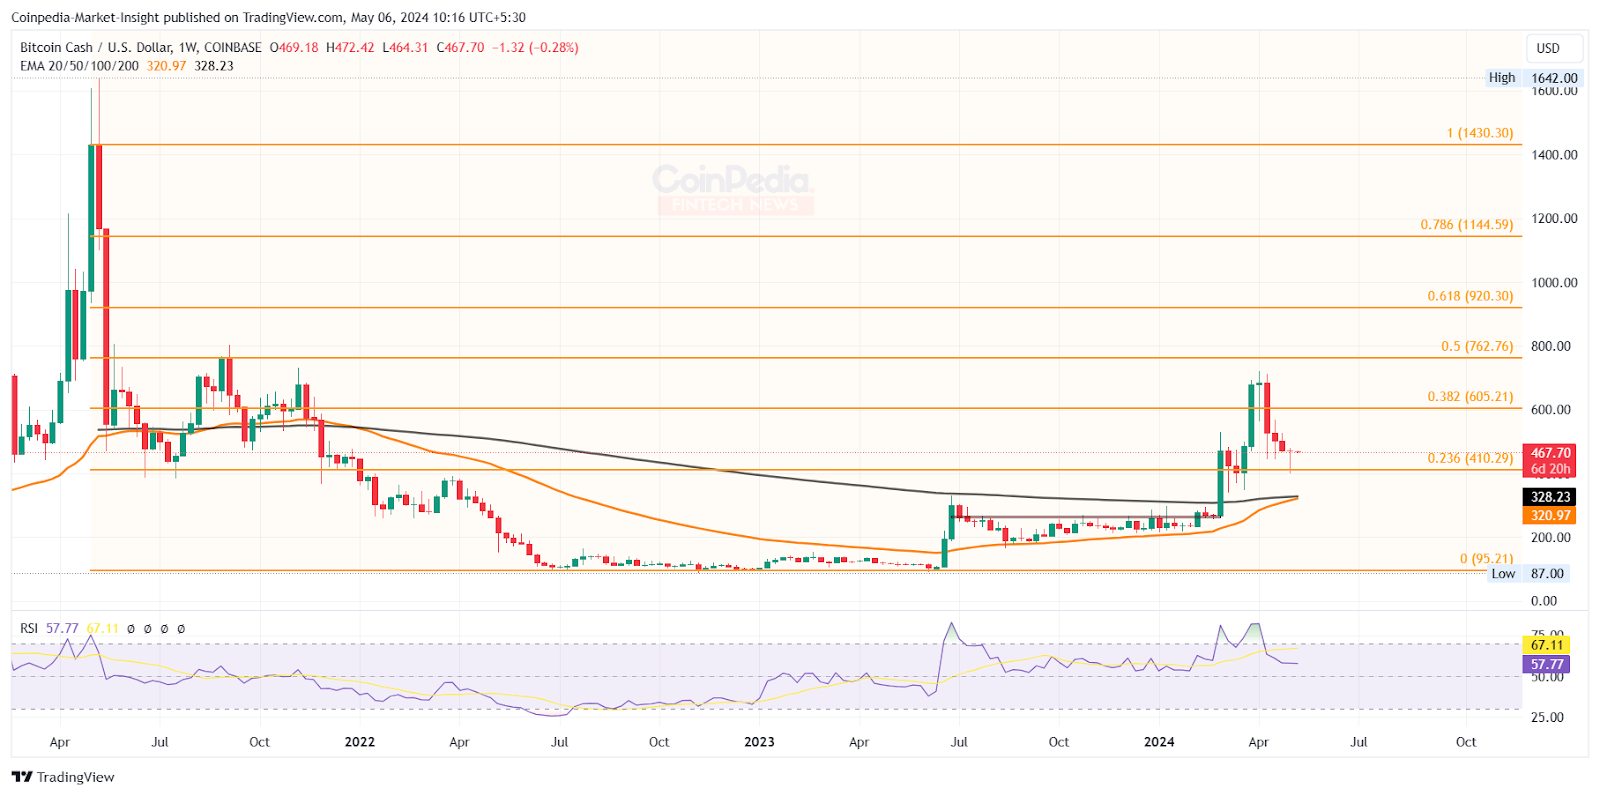
With a market cap of $9.34 Billion, Bitcoin Cash at #15 is skipping ranks in the list of top 100 altcoins. The BCH token price marks a downfall of 36% drop in April to break under the $500 psychological mark.
ビットコイン キャッシュの価格パフォーマンス 時価総額が 93 億 4,000 万ドルであるため、第 15 位のビットコイン キャッシュは、トップ 100 アルトコインのリストでランクを飛び越えています。 BCHトークンの価格は4月に36%下落し、心理的マークである500ドルを割りました。
Tradingview
トレーディングビュー
However, despite the sharp drop last month, the 1W chart provides a slightly bullish perspective. The long-tail rejection in the recent weekly candle reflects strong underlying demand at the $400 level.
ただし、先月の急落にもかかわらず、1W チャートはやや強気の見通しを示しています。最近の週足ローソク足におけるロングテールの拒否は、400ドルレベルでの強い潜在需要を反映しています。
The long-tail Doji candle increases the likelihood of a morning star pattern to revive the uptrend. Further, a broader market recovery could propel the BCH price beyond the $500 mark.
ロングテールの童子ローソクは、上昇トレンドを復活させるモーニングスターパターンの可能性を高めます。さらに、市場の回復が広がれば、BCH価格が500ドルを超える可能性がある。
Will The BCH Price Turn Green in May?
Currently, the Bitcoin Cash price trades at $474 and has recovered 9.29% in just six days of May. A bull run beyond $500 is possible because the uptrend sustains momentum.
5月にBCH価格は緑色に変わるか 現在、ビットコインキャッシュの価格は474ドルで取引されており、5月のわずか6日間で9.29%回復しました。上昇トレンドが勢いを維持しているため、500ドルを超える強気相場が可能です。
As per the Fibonacci levels, the BCH token price could reach the 50% level at $762.On the flip side, another spike in supply could retest $400.
フィボナッチレベルによると、BCHトークンの価格は762ドルで50%のレベルに達する可能性があります。逆に、供給がさらに急増すると、400ドルを再テストする可能性があります。
Technical indicators:
テクニカル指標:
EMAs: The high anticipations of a golden crossover in the 50 and 200 weekly EMAs bolster the uptrend chances.
EMA: 50 週間および 200 週間の EMA におけるゴールデンクロスオーバーへの高い期待により、上昇トレンドの可能性が高まります。
タグ価格分析
免責事項:info@kdj.com
提供される情報は取引に関するアドバイスではありません。 kdj.com は、この記事で提供される情報に基づいて行われた投資に対して一切の責任を負いません。暗号通貨は変動性が高いため、十分な調査を行った上で慎重に投資することを強くお勧めします。
このウェブサイトで使用されているコンテンツが著作権を侵害していると思われる場合は、直ちに当社 (info@kdj.com) までご連絡ください。速やかに削除させていただきます。


