 |
|
 |
|
 |
|
 |
|
 |
|
 |
|
 |
|
 |
|
 |
|
 |
|
 |
|
 |
|
 |
|
 |
|
 |
|
On the daily chart, XRP recently fell below an important support line around $2.44, which is a short-term bearish sign.

The price of XRP is currently trading in a neutral zone without a clear direction. Let’s take a closer look at the latest price analysis and what could happen next.
Key XRP Levels to Watch
On the daily chart, XRP recently fell below an important support level around $2.44, which is a short-term bearish sign.
At the moment, the price is finding some support near $2.30. If XRP breaks below this level, the next support to watch would be between $2.10 and $2.15.
On the other hand, resistance is now sitting between $2.43 and $2.44. If the price manages to move up, another major resistance level is at $2.60.
Fibonacci Levels Indicate Strong Resistance
The Fibonacci retracement tool shows a key resistance zone, also known as the golden pocket, between $2.55 and $2.62.
If XRP breaks above $2.62 with strong confirmation (daily candle closing above this level), it could set up a rally towards $2.90.
Could XRP Form a Large Inverse Head and Shoulders Pattern?
There’s a possibility that XRP might form a large inverse head and shoulders pattern, a bullish chart formation. However, this isn’t confirmed yet.
This pattern would form if the price:
* Reaches around $3.8 to complete the left shoulder of the pattern.
* Drops back to $2 to form the head of the pattern.
* Rises again to create the right shoulder of the pattern, potentially around the $3.4 region.
* Finally, breaks through the neckline of the pattern, which is around $2. In this case, it would be the 200-day moving average.
If this happens, it could set XRP up for a strong rally, potentially pushing the price above $3 and towards new all-time highs.
Disclaimer:info@kdj.com
The information provided is not trading advice. kdj.com does not assume any responsibility for any investments made based on the information provided in this article. Cryptocurrencies are highly volatile and it is highly recommended that you invest with caution after thorough research!
If you believe that the content used on this website infringes your copyright, please contact us immediately (info@kdj.com) and we will delete it promptly.
-

-

-

-

-

-

-

- RR vs PBKS Toss Update: Shreyas Iyer hands IPL debut to young Aussie, Sanju Samson replaces Jofra Archer with South African teenager
- May 18, 2025 at 06:45 pm
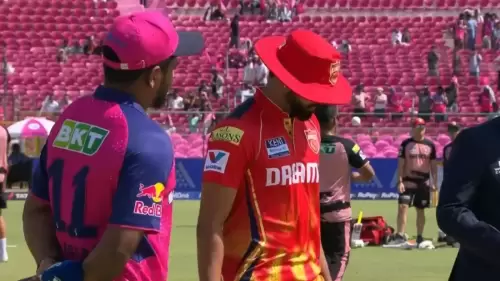
- Punjab Kings captain Shreyas Iyer won the toss and opted to bat first on May 18 at Sawai Mansingh stadium against Rajasthan Royals (RR). Iyer handed debut cap to Australia's 23-year-old batting order Mitchell Owen.
-

- Soaring Past $100k, Bitcoin (BTC) Dominates Headlines as These 5 Presale Projects Promise 1000x Returns
- May 18, 2025 at 06:45 pm
- With Bitcoin soaring past the $100,000 mark, cryptocurrencies are once again dominating the headlines. However, the market hasn't done much since the initial upward push ended.
-

- AGNT is turning heads, with analysts forecasting a 30,000% surge and the potential to surpass SHIB and PEPE.
- May 18, 2025 at 06:40 pm
- The buzz in the crypto world centers around a new contender poised to change the scene. Analysts suggest this rising star could surpass famed coins, creating unprecedented gains.


