 |
|
 |
|
 |
|
 |
|
 |
|
 |
|
 |
|
 |
|
 |
|
 |
|
 |
|
 |
|
 |
|
 |
|
 |
|
Cryptocurrency News Articles
Dogecoin (DOGE) Prepares for Breakout: Analysts Spot Bullish Chart Patterns
May 18, 2025 at 07:41 pm
Dogecoin ($DOGE) is drawing renewed attention from technical analysts, with two respected voices in the crypto space highlighting potentially bullish formations

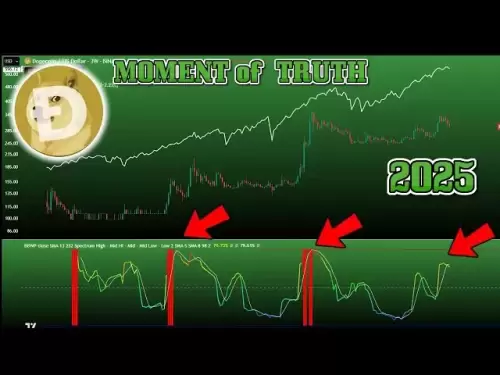
Dogecoin (DOGE) has been a hot topic among technical analysts, with two respected voices in the crypto space highlighting potentially bullish chart patterns that could drive the meme coin toward a strong upside move.
As spotted by analyst Ali Martinez, DOGE is currently forming a falling wedge, a classic bullish reversal pattern that occurs during a downtrend when price ranges are getting smaller, and lower lows are being created.
''Anticipating a 15% price move! As spotted on the chart, Dogecoin appears to form a falling wedge, a technical pattern known for indicating a period of consolidation or compression in price before a breakout or breakdown. This pattern is typically encountered in a trending market and signals a continuation of the existing trend.
A falling wedge is a bullish pattern that forms in a downtrending market. It is characterized by two converging lines of support and resistance, with each higher low forming a wedge shape. The pattern is completed when the price breaks out of the wedge to the upside.
If Dogecoin can break above the upper resistance line of the wedge decisively, it could validate the move toward higher price targets, potentially setting the stage for a 15% rally from current levels. However, traders are advised to monitor volume and candlestick confirmation closely, as breakouts from wedge patterns are more reliable with strong follow-through and volume participation.''
suggesting a potential breakout could send DOGE soaring 15% to hit levels around $0.21.
On the other hand, crypto influencer Carl Moon is spotting a bullish flag setup on DOGE’s 4-hour chart, which he says could propel the meme coin toward $0.29.
“$DOGE is about to take off! Once it breaks out of this bullish flag, the target is $0.29
suggesting a near 30% upside from current levels.
The bull flag follows a steep rally earlier in the month and suggests the price is temporarily consolidating before its next upward leg.
The post Dogecoin (DOGE) Price Eyeing $0.29 as Analyst Spots Bullish Flag appeared first on Benzinga.com.
Disclaimer:info@kdj.com
The information provided is not trading advice. kdj.com does not assume any responsibility for any investments made based on the information provided in this article. Cryptocurrencies are highly volatile and it is highly recommended that you invest with caution after thorough research!
If you believe that the content used on this website infringes your copyright, please contact us immediately (info@kdj.com) and we will delete it promptly.
-

-

-

-

- Nimanode, a first-of-its-kind AI automation platform has announced their project kickoff by emphasising they will be building on the XRP Ledger.
- May 19, 2025 at 01:45 am
- As a platform designed to power a new era of autonomous AI agents on-chain, the project is already drawing strong early interest as the presale looks
-

-

-

-

-


