


")


All-time High
$8.44
Nov 25,2021
All-time Low
$0.029
Nov 04,2020
Volume(24h)
$35.54M
Turnover rate
8.61%
Market Cap
$412.6084M
FDV
$473.7M
Circulating supply
$2.61B
Total supply
$3B
Max supply
Tags
Website
Socials
Contracts
Explorers
https://etherscan.io/token/0x3845badAde8e6dFF049820680d1F14bD3903a5d0
https://etherscan.io/token/0x3845badAde8e6dFF049820680d1F14bD3903a5d0
https://app.nansen.ai/token-god-mode?chain=ethereum&tab=transactions&tokenAddress=0x3845badAde8e6dFF049820680d1F14bD3903a5d0
https://polygonscan.com/token/0xBbba073C31bF03b8ACf7c28EF0738DeCF3695683
https://www.oklink.com/cn/eth/token/0x3845badAde8e6dFF049820680d1F14bD3903a5d0
https://basescan.org/address/0xac531Eb26Ca1d21b85126De8FB87E80E09002DcF

Currency Calculator
{{conversion_one_currency}}
{{conversion_two_currency}}
Community sentiment

26%
74%


Bullish

Bearish


The-sandbox Price Trend Prediction
| Year | 2026 | 2027 | 2028 | 2029 | 2030 | 2031 | 2032 | 2033 | 2034 | 2035 |
|---|---|---|---|---|---|---|---|---|---|---|
| Min.Price | 14.04 | 15.74 | 25.06 | 23.70 | 32.92 | 31.96 | 35.32 | 26.16 | 49.25 | 38.46 |
| Max.Price | 27.46 | 30.27 | 34.32 | 40.02 | 40.71 | 46.05 | 60.55 | 56.94 | 58.99 | 70.13 |
Periodic ROI Calculator
Calculation result details
| Principal | Number of purchases | Profit amount | Profit rate |
|---|---|---|---|
| {{calculate_data.total_investment}} | {{calculate_data.invest_count}} | {{calculate_data.profit}} | {{calculate_data.roi}}% |
Frequently Asked Questions about The Sandbox
{{question_one}}
{{question_two}}
{{question_three}}
{{question_four}}
{{question_five}}
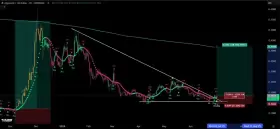
Artificial Superintelligence Alliance’s 50-Day, 200-Day Simple Moving Averages and 14-Day Relative Strength Index - RSI (14)
Artificial Superintelligence Alliance price prediction FAQs
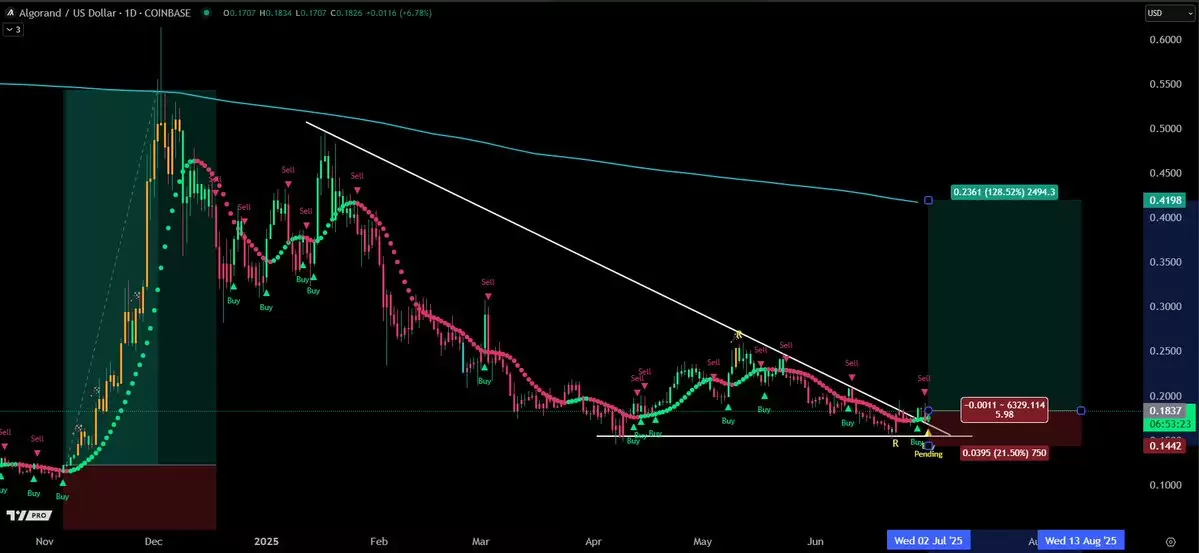
As of January 31, 2026,the overall price prediction sentiment for Artificial Superintelligence Alliance is Bearish, with 26 technical indicators showing bullish signals and 74 indicating bearish signals.
Buy or sell nowCustomizable Investment Planning Calculator
Calculation result details
Calculate your multi-portfolio strategy,possible future returnsand potential risk warningvalues.

{{profit_low}}
{{profit_high}}
We recommend exercising vigilance by staying abreast of the latest developments and conducting thorough due diligence. Many investors may opt to secure profits and rebalance their portfolios.
If you possess a highly bullish outlook and a commensurate risk tolerance, you may consider maintaining your position to capture further potential upside. However, it is imperative to proceed with caution and monitor the situation closely.
{{profit_gt_fifty}}
{{profit_middle}}
{{profit_lt_ten}}
Disclaimer:
The information provided is not trading advice.kdj.com is not responsible for any investments made based on the information provided on the page content.Cryptocurrencies are highly volatile,so it is recommended that you invest carefuly after thorough research!


