


All-time High
All-time Low
Volume(24h)
31.12M
Turnover rate
10.53%
Market Cap
295.5783M
FDV
611.5M
Circulating supply
268.28M
Total supply
555M
Max supply
555M
Tags
Socials
Contracts
Explorers
https://solscan.io/token/4k3Dyjzvzp8eMZWUXbBCjEvwSkkk59S5iCNLY3QrkX6R
https://solscan.io/token/4k3Dyjzvzp8eMZWUXbBCjEvwSkkk59S5iCNLY3QrkX6R
https://app.nansen.ai/token-god-mode?chain=solana&tab=transactions&tokenAddress=4k3Dyjzvzp8eMZWUXbBCjEvwSkkk59S5iCNLY3QrkX6R
https://explorer.solana.com/address/4k3Dyjzvzp8eMZWUXbBCjEvwSkkk59S5iCNLY3QrkX6R
https://bscscan.com/token/0x13b6a55662f6591f8b8408af1c73b017e32eedb8

Currency Calculator
{{conversion_one_currency}}
{{conversion_two_currency}}
Community sentiment

26%
74%


Bullish

Bearish


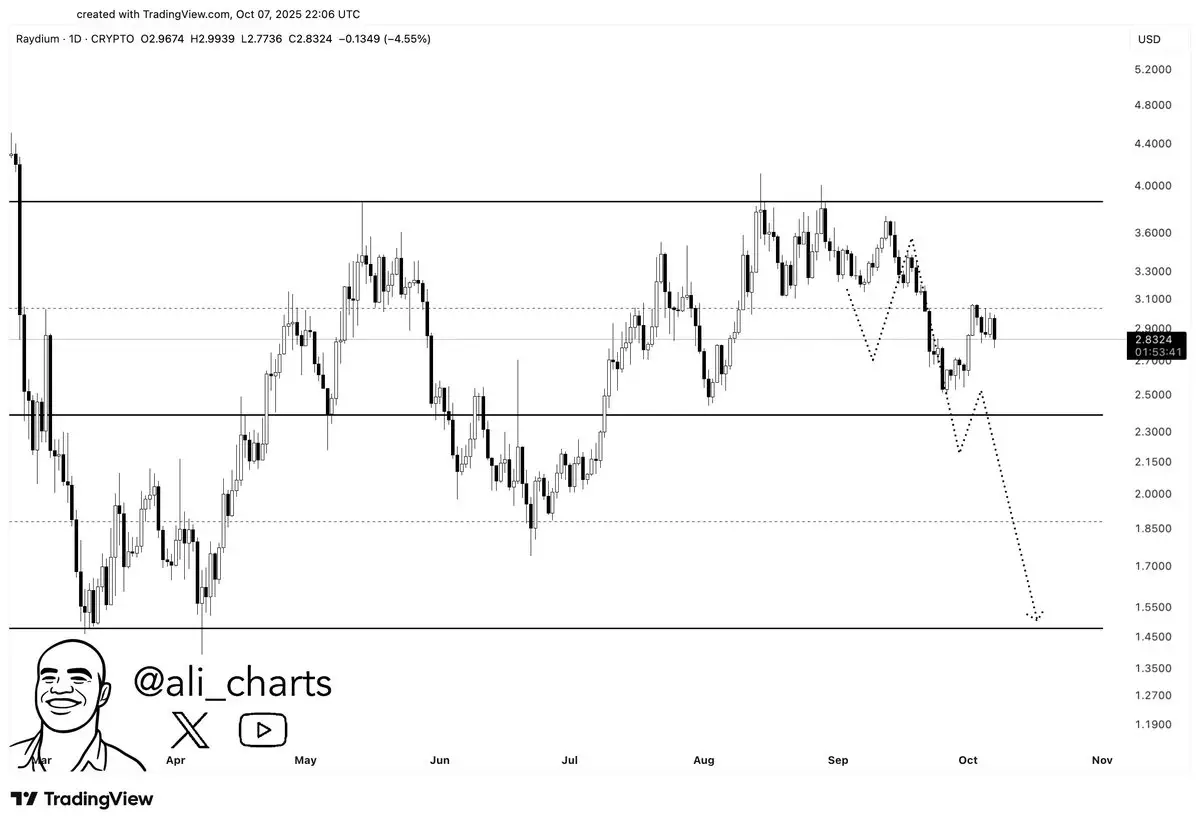


 Entering $RAY at these levels ($2.65)
  From $8.6 highs → now back to a solid accumulation zone. I see opportunity, not fear.
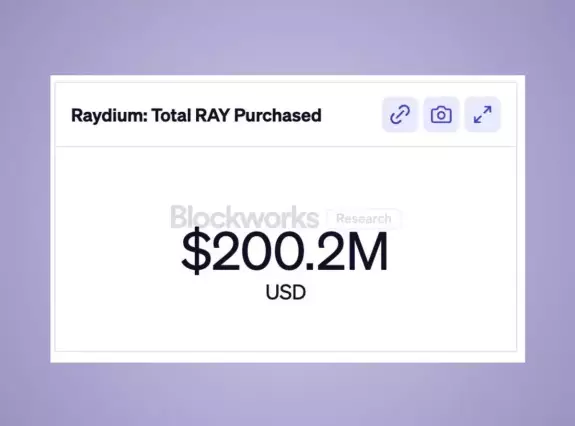
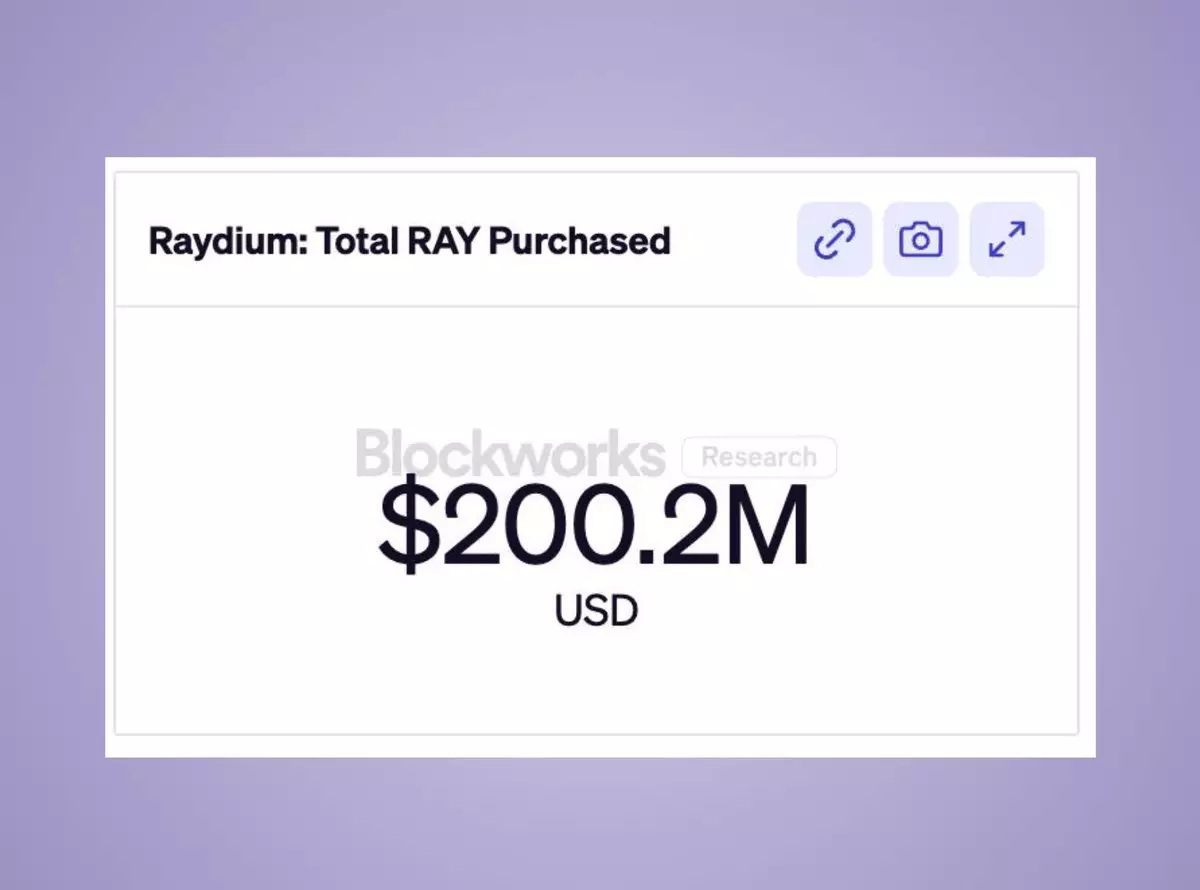
  Core Solana DeFi infra (every project touches $RAY) $230M+ tokens already bought & burned
  Market cap < $1B = huge upside
  I’m
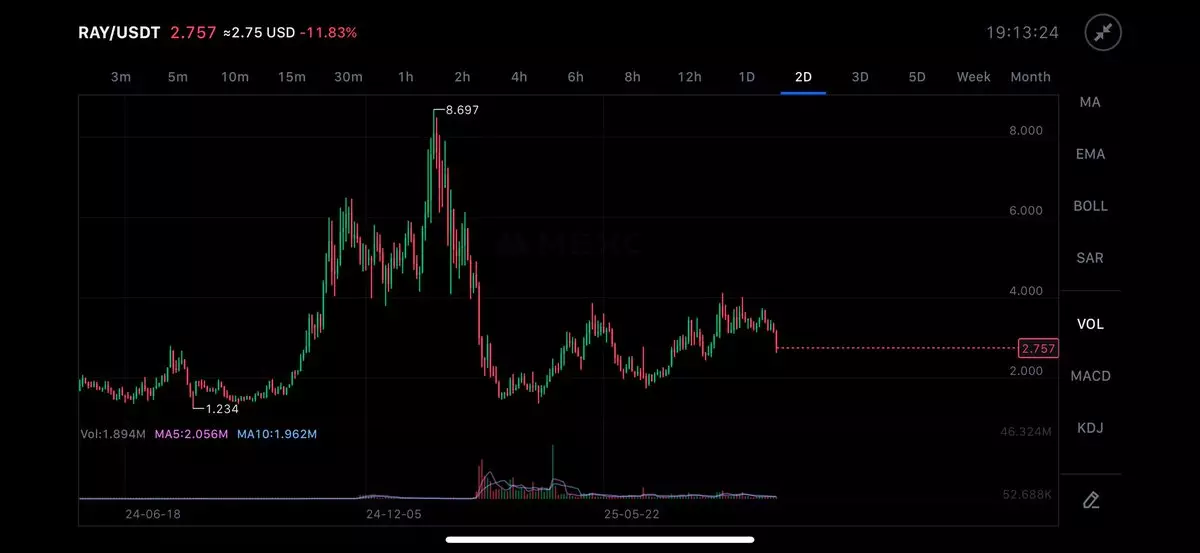
I’m $RAY | The DeFi Engine of Solana
  While most chase hype coins… $RAY is quietly building real value In my latest video, I broke it all down: $230M worth of tokens already bought back & burned Current market cap = just $850M — huge upside potential Core
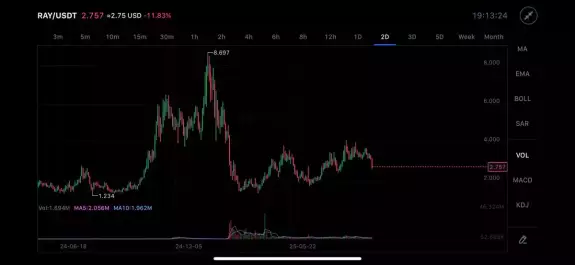


Artificial Superintelligence Alliance technical analysis
This gauge displays a technical analysis overview for your selected timeframe. The summary of Dogecoin is based on the most popular technical indicators, such as Moving Averages, Oscillators and Pivots.

Oscillators
| Name | Value | Action |
|---|---|---|
| Relative Strength Index (14) | {{analysis_data.oscillators.data.RSI.value}} | Neutral Sell Buy |
| Stochastic %K (14, 3, 3) | {{analysis_data.oscillators.data.STOCHK.value}} | Neutral Sell Buy |
| Commodity Channel Index (20) | {{analysis_data.oscillators.data.CCI.value}} | Neutral Sell Buy |
| Average Directional Index (14) | {{analysis_data.oscillators.data.ADX.value}} | Neutral Sell Buy |
| Awesome Oscillator | {{analysis_data.oscillators.data.AO.value}} | Neutral Sell Buy |
| Momentum (10) | {{analysis_data.oscillators.data.Mom.value}} | Neutral Sell Buy |
| MACD Level (12, 26) | {{analysis_data.oscillators.data.MACD.value}} | Neutral Sell Buy |
| Williams Percent Range (14) | {{analysis_data.oscillators.data.STOCHRSI.value}} | Neutral Sell Buy |
| Williams Percent Range (14) | {{analysis_data.oscillators.data.WR.value}} | Neutral Sell Buy |
| Bull Bear Power | {{analysis_data.oscillators.data.BBP.value}} | Neutral Sell Buy |
| Ultimate Oscillator (7, 14, 28) | {{analysis_data.oscillators.data.UO.value}} | Neutral Sell Buy |
Moving Averages
| Name | Value | Action |
|---|---|---|
| Exponential Moving Average (10) | {{analysis_data.moving_averages.data.EMA10.value}} | Neutral Sell Buy |
| Simple Moving Average (10) | {{analysis_data.moving_averages.data.SMA10.value}} | Neutral Sell Buy |
| Exponential Moving Average (20) | {{analysis_data.moving_averages.data.EMA20.value}} | Neutral Sell Buy |
| Simple Moving Average (20) | {{analysis_data.moving_averages.data.SMA20.value}} | Neutral Sell Buy |
| Exponential Moving Average (30) | {{analysis_data.moving_averages.data.EMA30.value}} | Neutral Sell Buy |
| Simple Moving Average (30) | {{analysis_data.moving_averages.data.SMA30.value}} | Neutral Sell Buy |
| Exponential Moving Average (50) | {{analysis_data.moving_averages.data.EMA50.value}} | Neutral Sell Buy |
| Simple Moving Average (50) | {{analysis_data.moving_averages.data.SMA50.value}} | Neutral Sell Buy |
| Exponential Moving Average (100) | {{analysis_data.moving_averages.data.EMA100.value}} | Neutral Sell Buy |
| Simple Moving Average (100) | {{analysis_data.moving_averages.data.SMA100.value}} | Neutral Sell Buy |
| Exponential Moving Average (200) | {{analysis_data.moving_averages.data.EMA200.value}} | Neutral Sell Buy |
| Simple Moving Average (200) | {{analysis_data.moving_averages.data.SMA200.value}} | Neutral Sell Buy |
| Ichimoku Base Line (9, 26, 52, 26) | {{analysis_data.moving_averages.data.Ichimoku.value}} | Neutral Sell Buy |
| Volume Weighted Moving Average (20) | {{analysis_data.moving_averages.data.VWMA.value}} | Neutral Sell Buy |
| Hull Moving Average (9) | {{analysis_data.moving_averages.data.HullMA.value}} | Neutral Sell Buy |
Pivots
| Pivots | Classic | Fibonacci | Camarilla | Woodie | DM |
|---|---|---|---|---|---|
| {{index}} | {{val.Classic}} | {{val.Fibonacci}} | {{val.Camarilla}} | {{val.Woodie}} | {{val.Demark}} |
Artificial Superintelligence Alliance Token Unlock
| Date | Total Unlocked | %Max Supply | Allocations | ||
|---|---|---|---|---|---|
| {{item.time}} | {{item.total_amount}} RAY ${{item.total_amount_usd}} | {{item.max_percentage}}% | {{item.data.length}} allocation Unlock Allocation
| ||
| {{item.time}} | {{item.total_amount}} RAY ${{item.total_amount_usd}} | {{item.max_percentage}}% | {{item.data.length}} allocation Unlock Allocation
|
Buy / Sell

Binance
The world’s leading cryptocurrency exchange. Trade a vast array of digital assets, including Spot, Futures, Earn, NFT, Launchpad, and more. Secure and user-friendly, empowering your crypto journey and unlocking endless possibilities!

Ouyi OKX
The world’s leading cryptocurrency exchange. Provides rich currency trading and derivative services such as Bitcoin and Ethereum. There are also currency earning, NFT market and Web3 wallets to help you explore the crypto world in one-stop. Safe and easy to use, experience now!
 Sponsored

The URL has been copied. share it with your friends now!